Influenza in Sweden – Season 2018–2019
Summary
The 2018–2019 season in Sweden was dominated by influenza A and reached a moderate level of intensity. According to several surveillance systems, the season was less intense than the five previous seasons. The epidemic started in the second week of December (week 50) and reached its peak in mid-February (week 6). The laboratories in Sweden reported 13,757 influenza cases during the season, which was fewer cases than in the previous season. Ninety-nine percent of these were influenza A. Influenza A(H1N1)pdm09 dominated until week 10, when dominance shifted to influenza A(H3N2). The distribution within subtyped laboratory samples was 63 percent A(H1N1)pdm09 and 37 percent A(H3N2).
At the national level, the number of reported cases increased after the epidemic started in December and then reached a plateau around the Christmas and New Year holidays. A similar trend is seen most seasons. During the initial weeks of the influenza epidemic, the number of cases primarily increased in northern Sweden, where a pronounced peak was seen in week 52 and another peak in week 7. The incidence in the middle and southern parts of Sweden was highest during weeks 5 and 6, respectively.
Both phone calls to the medical advice line 1177 and web searches reflected a moderate level of influenza activity during the season. According to phone call data, many parents called about fever among children this season, particularly children 0–4 years of age. The proportion of calls about fever in this age group was significantly higher than the previous five seasons. The incidence of laboratory-confirmed cases was also high in this age group compared to previous seasons. Because influenza A(H1N1)pdm09 has not circulated to a greater extent in Sweden since the 2015–2016 season, many younger children who had not yet been infected with this type of influenza were affected this season.
Fewer people in the age group 65 years and older fell ill during the season than during the previous two seasons. Prolonged influenza activity was seen in this age group towards the end of the season, as influenza A(H3N2) began to dominate the season. No influenza-related excess mortality was seen among people 65 years and older, although a small peak in all-cause excess mortality was seen in week 1, 2019, in northern Sweden. Because the season was dominated by A(H1N1) pdm09 and reached only a moderate intensity level, mortality was lower than during a typical A(H3N2) season, as well as the 2017–2018 season, which was dominated by influenza B/Yamagata. Among patients who received a laboratory-confirmed flu diagnosis, 505 (3.8 percent) had died within 30 days. In total, 88 percent of deaths were among people aged 65 years and older. The proportion of patients who died increased with increasing age.
During the 2018–2019 season, the average vaccination coverage among people 65 years and older was 52 percent, which was higher than the previous seven seasons. Coverage increased in all age groups despite a vaccine shortage that emerged at the end of November 2018. During the vaccine shortage, the Public Health Authority published updated recommendations regarding prioritization of and among risk groups (1). In January 2019, additional doses were delivered to Sweden, but by then efforts to vaccinate and interest in vaccination had decreased.
During the season, 359 patients with influenza were reported as having received intensive care across the country, which is fewer than during the previous season. Nearly all patients (99.5%) had influenza A. Samples were subtyped for only 11 percent of patients with influenza A and results showed that 85 percent had influenza A(H1N1)pdm09. The greatest number of patients were admitted to intensive care during week 7 (36 patients), which is the week after the laboratory-confirmed cases of influenza peaked. A large number of patients (34 patients) were also admitted to intensive care in week 52 at the start of the seasonal epidemic.
Of all reported cases, 74 percent were in a risk group for severe influenza illness, either due to age (65 years and older) or due to one or more medical risk factors. The age distribution among intensive care patients under 65 was similar to the 2015–2016 season, which was dominated by influenza A(H1N1)pdm09, but a greater proportion of patients overall were people 65 years and older. Of those who belonged to a risk group and needed intensive care during this season, only 29 percent with known vaccination status were vaccinated.
Characterisation of the viral strains collected through sentinel sampling and from laboratories around Sweden showed antigenic similarity to the A(H1N1)pdm09 vaccine strain. The majority of the A(H3N2) strains showed antigenic similarity to cell-cultured but poor similarity to egg-cultured vaccine strains. For the upcoming season, the A(H3N2) and A(H1N1)pdm09 components of the vaccine have been changed. Only a few influenza B strains have been characterized. Of these, the B/Yamagata strains were antigenically similar to the vaccine strain in the tetravalent vaccine (but not included in the trivalent vaccine) and most of the B/Victoria strains belonged to genetic group 1Adel162–164, which has poor antigenic similarity to the vaccine strain. None of the 260 strains analysed had any mutations associated with resistance to neuraminidase inhibitors.
In sentinel surveillance, influenza was detected in 31 percent of all samples. Influenza A was detected in 99 percent of these and influenza B in 1 percent. As in the laboratory-based reporting, the start of the season was dominated by A(H1N1)pdm09, but in week 10 the proportion of A(H3N2) increased. Cumulatively, the distribution was 76 percent A(H1N1)pdm09 and 24 percent A(H3N2). Vaccine break-through infections were detected in 5 percent of patients with A(H1N1)pdm09 (median age 64 years) and 11 percent of patients with A(H3N2) (median age 60 years). The Public Health Agency participates in the European Influenza Monitoring Vaccine Effectiveness (I-MOVE) network with data from Swedish sentinel sampling. In the interim report for the 2018–2019 season, the vaccination effect was good for A(H1N1)pdm09 (45 to 71 percent) and low for A(H3N2) (<0 to 24 percent). There were too few influenza B strains to determine the vaccination effect.
Sammanfattning
Antalet rapporterade fall av influensa nådde en medelhög intensitet under säsongen 2018–2019 som enligt flera övervakningssystem var mindre intensiv än de fem föregående. Säsongen dominerades av influensa A(H1N1)pdm09 med en efterföljande våg av influensa A(H3N2). Epidemin startade vecka 50 och nådde sin topp vecka 6. Totalt rapporterades 13 757 laboratorieverifierade influensafall, varav 99 procent var influensa A, vilket innebär färre fall än under den föregående säsongen. Influensa A(H1N1)pdm09 dominerade fram till vecka 10, då dominansen skiftade till influensa A(H3N2). Fördelningen av de subtypade proverna var 63 procent A(H1N1)pdm09 och 37 procent A(H3N2).
På nationell nivå ökade antalet rapporterade fall efter epidemistarten i december, men ökningen mattades av och antalet nådde en platå kring årsskiftet. En liknande trend med minskad spridning under jul- och nyårshelgerna ses de flesta säsongerna. Under de inledande veckorna av influensaepidemin ökade antalet fall främst i Norrland där en uttalad topp sågs vecka 52 och ytterligare en topp vecka 7. Incidensen i Svealand och Götaland var högst under vecka 5 respektive 6.
Både telefonsamtal till 1177 Vårdguiden och Webbsök visade på en medelhög aktivitet under denna säsong. Enligt 1177 Vårdguiden var det många föräldrar som ringde om barn med feber, och för barn 0–4 år var andelen samtal om feber markant högre jämfört med de föregående fem säsongerna. Även incidensen av laboratorieverifierade fall var hög i denna åldersgrupp jämfört med föregående säsonger. Influensa A(H1N1)pdm09 hade inte cirkulerat i någon större omfattning i Sverige sedan säsongen 2015–2016, och därför drabbades många yngre barn eftersom de ännu inte infekterats av den influensatypen.
Färre i åldersgruppen 65 år och äldre blev sjuka under säsongen än under de två föregående. I denna åldersgrupp sågs en utdragen aktivitet när A(H3N2) började dominera säsongen. Ingen influensarelaterad överdödlighet uppmättes bland personer 65 år och äldre men en liten topp i det totala antalet dödsfall i Sverige sågs vecka 1 2019 i Norrland. Eftersom säsongen dominerades av A(H1N1)pdm09 och var medelintensiv var överdödligheten lägre än under en A(H3N2)-säsong och även jämfört med säsongen 2017–2018, som dominerades av B/Yamagata. Bland patienterna med en laboratorieverifierad influensadiagnos hade 505 stycken (3,8 procent) dött inom 30 dagar. Totalt 88 procent av dödsfallen inträffade i åldersgruppen 65 år och äldre. Andelen dödsfall ökade med stigande ålder.
Vaccinationstäckningen bland personer 65 år och äldre var 52 procent, vilket var högre än de föregående sju säsongerna. Täckningen har ökat i samtliga åldersgrupper, trots vaccinbristen som uppstod i slutet av november 2018. Under vaccinbristen publicerade Folkhälsomyndigheten uppdaterade rekommendationer för prioritering av och mellan riskgrupper (1). I januari 2019 levererades ytterligare doser till Sverige men då hade vaccinationsarbetet och intresset minskat.
Under säsongen rapporterades att 359 patienter i landet med influensa fick intensivvård, vilket är färre än under den föregående säsongen. Av dessa patienter hade nästan alla influensa A (99,5 procent). Provet subtypades för endast 11 procent, och då framkom att 85 procent hade smittats av influensa A(H1N1)pdm09. Under vecka 7 var det flest patienter som behövde intensivvård (36 patienter), vilket var veckan efter då flest laboratorieverifierade fall rapporterades. Flera influensapatienter (34 patienter) behövde intensivvård under vecka 52, vilket var precis när säsongens epidemi hade tagit fart.
Av alla intensivvårdade patienter tillhörde 74 procent minst en medicinsk riskgrupp eller var 65 år och äldre. Åldersfördelningen bland intensivvårdade patienter under 65 år liknade den för säsongen 2015–2016, som dominerades av influensa A(H1N1)pdm09, men en större andel var 65 år och äldre. Av de som tillhörde en riskgrupp och behövde intensivvård var endast 29 procent vaccinerade, sett till dem med känd vaccinationsstatus.
Viruskarakteriseringen görs på ett urval av de stammar som samlas in genom sentinelprovtagningen och från laboratorier i landet. Den visar antigenisk likhet med vaccinstammen för A(H1N1)pdm09. Majoriteten av A(H3N2)- stammarna var antigeniskt lika cellodlad vaccinstam, medan likheten med äggodlad vaccinstam var sämre. Endast ett fåtal influensa B-stammar har karaktäriserats; B/Yamagata-stammarna var antigeniskt lika vaccinstammen i det tetravalenta vaccinet (ingår inte i det trivalenta vaccinet) och merparten av B/Victoria-stammarna tillhör den genetiska gruppen 1Adel162–164, som har dålig antigenisk likhet till vaccinstammen. Ingen av de 260 analyserade stammarna hade någon mutation som var associerad med resistens mot neuraminidashämmare.
Inom sentinelprovtagningen påvisades influensa i totalt 31 procent av proverna. Influensa A påvisades i 99 procent och influensa B i 1 procent av proverna. Början av säsongen dominerades av A(H1N1)pdm09, men vecka 10 ökade andelen A(H3N2). Sett över hela säsongen var 76 procent av fallen A(H1N1)pdm09 och 24 procent A(H3N2). Vaccinationsgenombrott påvisades hos 5 procent av patienterna med A(H1N1)pdm09 (medianålder 64 år) och 11 procent av patienterna med A(H3N2) (medianålder 60 år). Folkhälsomyndigheten deltar i det europeiska nätverket I-MOVE (European Influenza Monitoring Vaccine Effectiveness) för att mäta influensavaccinets effekt, med data från den svenska sentinelprovtagningen. Vid interimsrapporten för säsong 2018–2019 var vaccinationseffekten god (45 till 71 procent) för A(H1N1)pdm09 och låg (<0 till 24 procent) för A(H3N2). När det gäller influensa B var stammarna för få för att fastställa vaccinationseffekten (2).
About this publication
This report describes the monitoring systems for influenza in use during the winter season of 2018–2019 and the results of both epidemiological and virological surveillance. Data are also compared to previous influenza seasons.
The report has been prepared for the World Health Organization (WHO) as part of the Public Health Agency of Sweden’s function as a National Influenza Centre (NIC).
Annual reports in English about the influenza seasons in Sweden have been available since 1997, and those from 2000–2001 onward can be found on the Public Health Agency’s website (suggested search “Influenza in Sweden”) (3).
Public Health Agency of Sweden
Adam Roth
Head of Unit
Unit for Vaccination Programs
Mia Brytting
Head of Unit
Unit for Laboratory Surveillance of Viral Pathogens and Vaccine Preventable Diseases
Influenza surveillance in Sweden
Influenza epidemics recur in Sweden each winter, with a range of effects depending on the characteristics of the circulating viruses and the level of immunity in different age groups. New influenza strains, particularly those different enough to cause a pandemic, can be very aggressive and can cause severe illness, and these can cause great strain on intensive care units and can lead to deaths in all age groups. None of these effects is detectable through a single reporting system. In order to get an overall picture of on-going influenza activity and to remain prepared in case of a pandemic, the Public Health Agency of Sweden (Folkhälsomyndigheten) has a number of different epidemiological reporting systems for influenza ranging from the collection of data from different healthcare providers to the analysis of web searches.
Virological surveillance is as important as epidemiological reporting systems. Viruses are typed as influenza A or B by regional laboratories in real time during the influenza season, and some laboratories also determine the subtype for influenza A. Throughout the season, viruses from around the country are characterised by the Public Health Agency with regard to subtype and lineage, vaccine similarity, sensitivity to antiviral drugs, and other factors that might affect the severity of the infections they cause. Viruses are also isolated and sent to the WHO Collaborating Centre (WHO CC) in London for further characterisation and to provide a basis for vaccine strain selection. When new strains of influenza virus emerge, reference methods for diagnostics are established at the Public Health Agency and shared with all microbiological laboratories in Sweden.
During the influenza season, the Public Health Agency condenses national and international data into a detailed weekly bulletin that is published on the agency’s website (4). A preliminary summary of the 2018–2019 season was published on June 17, 2019 (5). The bulletin provides timely analysis of the current situation in Sweden and abroad and has a wide readership.
Vaccine strains
In February 2019, and with an update in March, the WHO recommended that the tetravalent vaccines for use in the northern hemisphere in the 2019–2020 season contain the following viruses (6, 7):
- A/Brisbane/02/2018 (H1N1)pdm09-like virus
- A/Kansas/14/2017 (H3N2)-like virus
- B/Colorado/06/2017-like virus (B/Victoria lineage)
- B/Phuket/3073/2013-like virus (B/Yamagata lineage).
The recommended B-component of trivalent vaccines is B/Colorado/06/2017-like virus (B/Victoria lineage).
Updates to National policies and recommendations
During the 2018–2019 season, the following policies and recommendations were published:
- Updated vaccination recommendations, September and November 2018 (1), specifically including:
- Recommendations for the prioritisation of individuals in risk groups in case of a shortage of influenza vaccine, including a recommended prioritisation order among risk groups, if needed.
- Change from half to full dose for trivalent inactivated influenza vaccines for children 6 months to 35 months. Dose for tetravalent inactivated influenza vaccine continues to be full dose.
- Updated web-based information about vaccination, the vaccine shortage, and influenza and pandemic preparedness continuously throughout the season.
- Health-economic and effectiveness literature review of trivalent and tetravalent influenza vaccines, October 2018 (8).
Work is on-going on updates to other pandemic preparedness documents, including a new National Pandemic Strategy. The latest documents can be found on the Public Health Agency website under Pandemic Preparedness (9).
Surveillance 2018–2019
The pyramid below illustrates the different outcomes and levels of severity and the corresponding surveillance systems for individuals infected with influenza (Figure 1), ranging from the large number of infected individuals to the small number who die as a result of the influenza infection. Table 1 describes the data collection systems that the Public Health Agency used to monitor influenza activity at the various levels of the influenza pyramid in Sweden during the 2018–2019 season and shows a summary of results of each system. Each system is described further at the start of each section below showing the season’s results in detail.
Table 2 shows which week each system, as applicable, crossed the threshold for epidemic start, reached its peak notation, and crossed the threshold for the end of the epidemic, as well as the maximum intensity level measured by the system during the season.
Figure 1. The “influenza pyramid” showing possible outcomes of an influenza infection and the surveillance systems at each level.
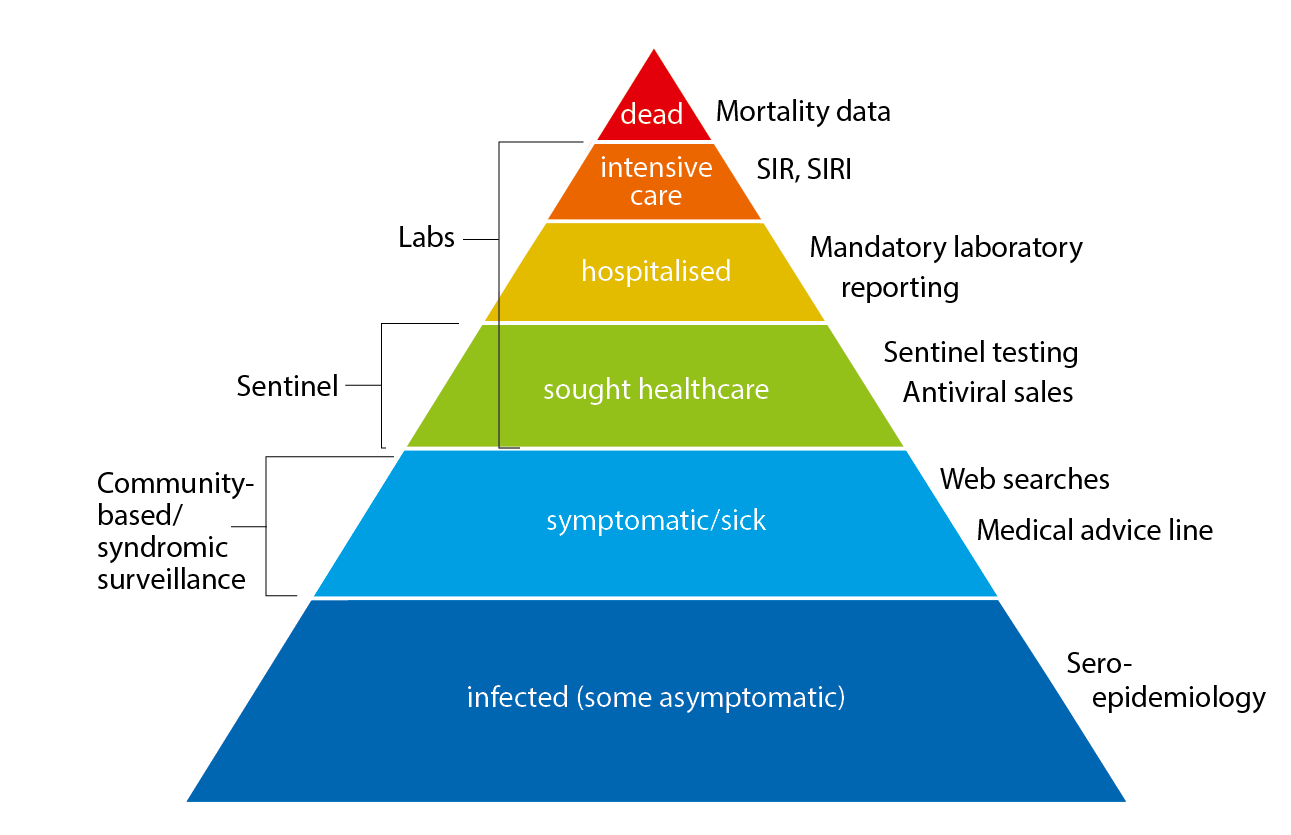
SIR: Swedish Intensive Care Registry
SIRI: Swedish Intensive Care Registry – Influenza module
| Reporting system/method | Implementation | What does the system/method show? | Results (2018–2019) | ||
|---|---|---|---|---|---|
|
Statutory laboratory reporting of influenza Voluntary reporting of denominator data and sub-/lineage typing results |
Legal obligation for all laboratories to report influenza diagnoses along with full patient identity in the web-based reporting system, SmiNet, in accordance with the Communicable Diseases Act. Voluntary reporting of number of samples tested sent via email. |
Number of laboratory-confirmed cases of influenza A and B together with age, gender, and geographical distribution. Proportion of samples tested that are positive for an influenza virus and sub-/lineage type |
13,664 laboratory-confirmed cases of influenza A and 93 cases of influenza B. 83,325 samples, 16.5% positive:99% influenza A1% influenza B Of influenza A cases subtyped:63% A(H1N1)pdm0937% A(H3N2) Of influenza B cases with determined lineage:50% B/Yamagata |
||
| Antiviral sales | Weekly data from the Swedish eHealth Agency | Number of packages sold by type of sale, including prescriptions and health care requisitions. | 16,615 packages | ||
| Voluntary clinical reporting of laboratory-confirmed influenza cases (all types) in intensive care (SIRI) | Collaboration with the Swedish Intensive Care Registry (SIR). Treating physicians in intensive care units voluntarily report clinical information about patients with laboratory-confirmed influenza. | Severity of infections by different influenza subtypes and impact on the intensive care units. |
359 laboratory-confirmed cases of influenza were reported from SIRI. Of those, 316 were reported as influenza A (unknown subtype), 35 were A(H1N1)pdm09, 6 were A(H3N2), and 2 were influenza B. |
||
| Excess mortality | Weekly data on the aggregated number of deaths in Sweden, by age group, is sent from the Swedish Tax Agency to the Public Health Agency and analysed with statistical models. |
Influenza-attributable excess mortality (FluMoMo model) All-cause mortality (EuroMoMo model) |
No influenza-attributable excess mortality. Small peak in all-cause excess mortality in week 1, 2019, in northern Sweden (Norrland). | ||
| Deaths within 30 days | Weekly data on date of death are sent from the Swedish Tax Agency to the Public Health Agency and analysed intermittently. | Death within 30 days of influenza diagnosis | 505 of 13,324 persons with an influenza diagnosis had died within 30 days of diagnosis, of which 99% were influenza A. Most (88%) were aged 65 years and older. | ||
| Sentinel sampling | Samples from some patients who present with influenza-like illness (ILI), as well as some patients with acute respiratory illness (ARI), are analysed by the Public Health Agency for influenza. | The proportion of sentinel patients with ILI or ARI who have an influenza infection (see also virus characterisation below). |
1,323 samples were analysed, of which 408 (31%) tested positive for influenza: 73% A(H1N1)pdm09 23% A(H3) 1% B/Victoria-like <1% b yamagata-like 3% a not subtyped (low viral load) 92% of the patients had clinical symptom of ILI. |
||
| Virus characterisation | Continual genotypic and phenotypic assays of laboratory and sentinel samples that tested positive for influenza. | Viruses' genetic affiliation and genetic vaccine similarity, and possible resistance to antiviral drugs. |
Genetic characterisation All 152 A(H1N)pdm09 viruses as well as the A(H1N2) seasonal reassortant belonged to group 6B.1, a subgroup in which the majority of the viruses have antigenic properties similar to the vaccine virus (6). 83 of 95 A(H3N2) viruses as well as an H3 virus with unconfirmed N type (due to incomplete sequencing results) belonged to subgroup 3C.2a1b, 10 belonged to group 3C.2a2, and 3 belonged to group 3C.3a. Viruses in group 3C.2a are antigenically similar to cell culture propagated vaccine virus but not to egg propagated. Group 3C.3a viruses have low similarity to the vaccine virus (6, 7). The two analysed B/Yamagata viruses belonged to genetic group 3. The majority of circulating viruses in this genetic group are antigenically similar to both cell culture and egg propagated vaccine virus (6). Four B/Victoria viruses belonged to group 1Adel162–164 and one to group 1A. Both these groups reacted less well with antisera raised against current vaccine (6). Analysis of the neuraminidase gene with respect to mutations associated with reduced or highly reduced inhibition to neuraminidase inhibitors: 325 viruses were analysed, where 65 A(H1N1)pdm09 viruses were exclusively analysed for the H275Y mutation. No mutations associated with reduced or highly reduced inhibition were detected. |
||
| Vaccination coverage | Periodic collection of coverage data from county councils. | Vaccination coverage per age group. |
52.2% coverage among those 65 years or older. ~2% coverage among risk groups under 65 years. |
||
| Webbsök (Web Search) | An automated system that uses search data from the national medical advice site 1177.se. The numbers of searches for influenza and influenza symptoms are entered into a statistical model that estimates the proportion of patients with ILI visiting general practitioners. | Estimates the proportion of patients with ILI. |
Between week 27, 2018, and week 12, 2019,* a total of 308,671 queries related to influenza were entered, which was 4.8% of the total number of queries on the website 1177.se. Webbsök’s influenza season lasted for 21 weeks* (week 44, 2018–week 12, 2019), with week 52, 2018, and weeks 5–7, 2019, at medium-high levels. *The surveillance was suspended week 12 due to technical developments. |
||
| Telephone Advice Line (1177 Vårdguiden) |
Weekly aggregated data on the primary reason for contacting the medical advice line (phone number 1177) and the age group of the person concerned are manually reported to the Public Health Agency through the system Hälsoläge. Data are collected from 18 of Sweden’s 21 county councils (Stockholm, Sörmland, and Värmland are excluded because of data irregularities). |
Primary reason for calling by age group (adults and children). | Approximately 109,200 calls regarding fever in children. Fever in children accounted for 5.6% of all calls to 1177 during the year. The epidemic started in week 50, 2018, and the peak was week 6, 2019, with 9.8% of calls due to fever in children. The epidemic ended in week 16. | ||
| Hälsorapport (Health Report) | Web-based reporting system with 5,900 participants age 1–85 years. Weekly symptoms reports during the period of week 51, 2018, to week 10, 2019. | Percentage of the population with ILI and ARI per week and age group. | The highest ILI rate was 2.2% (week 6), and the average was 1.7%. The highest ARI rate was 7.0% (week 6), and the average was 5.2%. | ||
| System | Start | Peak | End | Max intensity |
|---|---|---|---|---|
| Laboratory-based surveillance (number of cases) | 50 | 6 | 18 | Medium |
| Laboratory-based surveillance (% positive) | 50 | 5-6 | 18 | Low |
| Antiviral sales | * | 51, 6-7 | * | * |
| Laboratory-confirmed influenza cases in intensive care (SIRI) | * | 7 | * | * |
| Excess mortality | none | none | none | * |
| Sentinel sampling | 49 | 8 | 15 | * |
| Webbsök (Web Search) | 44 | 52, 5-7 | ** | Medium |
| Telephone Advice Line (1177 Vårdguiden) | 50 | 6 | 16 | Medium |
| Hälsorapport | * | 6 | * | * |
| * Epidemic thresholds/intensity levels not assigned. ** Surveillance suspended week 12, 2019. |
||||
Laboratory-based surveillance
All laboratory-confirmed cases of influenza have statutory reporting requirements (as of Dec 1, 2015), but subtyping is not required. Denominator data (the total number of samples analysed) are reported voluntarily via e-mail. Samples analysed for influenza at the laboratories in Sweden have historically primarily been done in hospital settings, but the proportion of cases reported from outpatient settings has increased in recent years.
The 2018–2019 influenza season was entirely dominated (99 percent) by influenza A. The epidemic started in week 50 (early December) and continued for 21 weeks until it ended in week 18. As in previous seasons, the number of laboratory-confirmed influenza cases increased throughout the month of December and then reached a plateau during the holidays at the end of the year. A sharp increase in the number of cases was seen in week 4 leading to the peak in week 6, when 1,296 cases were reported (see Figure 2). Only a limited number of cases of influenza B were reported during the season.
The majority of the cases (>99%) during the peak (week 6) were influenza A, and based on the samples that were subtyped influenza A(H1N1)pdm09 was the dominating subtype during the season overall. After the peak in week 6, however, the proportion of influenza A(H3N2) started to increase, and in week 10 the dominating subtype of influenza A shifted from A(H1N1)pdm09 to A(H3N2). Influenza A most recently dominated the season in Sweden during 2016–2017 and 2015–2016, when influenza A(H3N2) and influenza A(H1N1)pdm09 circulated, respectively.
In comparison with recent seasons, the number of reported laboratory-confirmed influenza cases during the current season (13,757) was similar to the number of cases in 2016–2017, but lower than the intense season of 2017–2018 (Table 3). During the peak week (week 6), the number of cases (1,296) was also similar to the peak week of 2016–2017 (see Figure 2). During the previous season, 2017–2018, there was a significant increase of samples taken for influenza diagnosis; a high number of samples taken were also reported during the 2018–2019 season. Overall, 16.5 percent of the samples taken were positive for influenza, which is lower compared to previous seasons, in part reflecting the lower intensity of the season (Table 3, Figure 3).
An analysis of the level of care for reported influenza cases over the past four seasons has shown that the proportion of cases from outpatient settings has increased, whereas the proportion of cases from inpatient settings has decreased slightly (Figure 4). Faster and increased availability of virological analysis of samples has most likely contributed to the increase of both sampling and the reported number cases from outpatient care settings. During the last few years, diagnostics have also been implemented at hospitals that did not previously have microbiological laboratories, and this change has thus facilitated fast “around-the-clock” analysis for influenza in more hospitals than ever before. The increased sampling might also contribute to the low percentage of positive samples of influenza this current season.
Figure 2. Total number of laboratory-confirmed cases of influenza (all types) per week and the dominating influenza type(s) per season, 2015–2019.
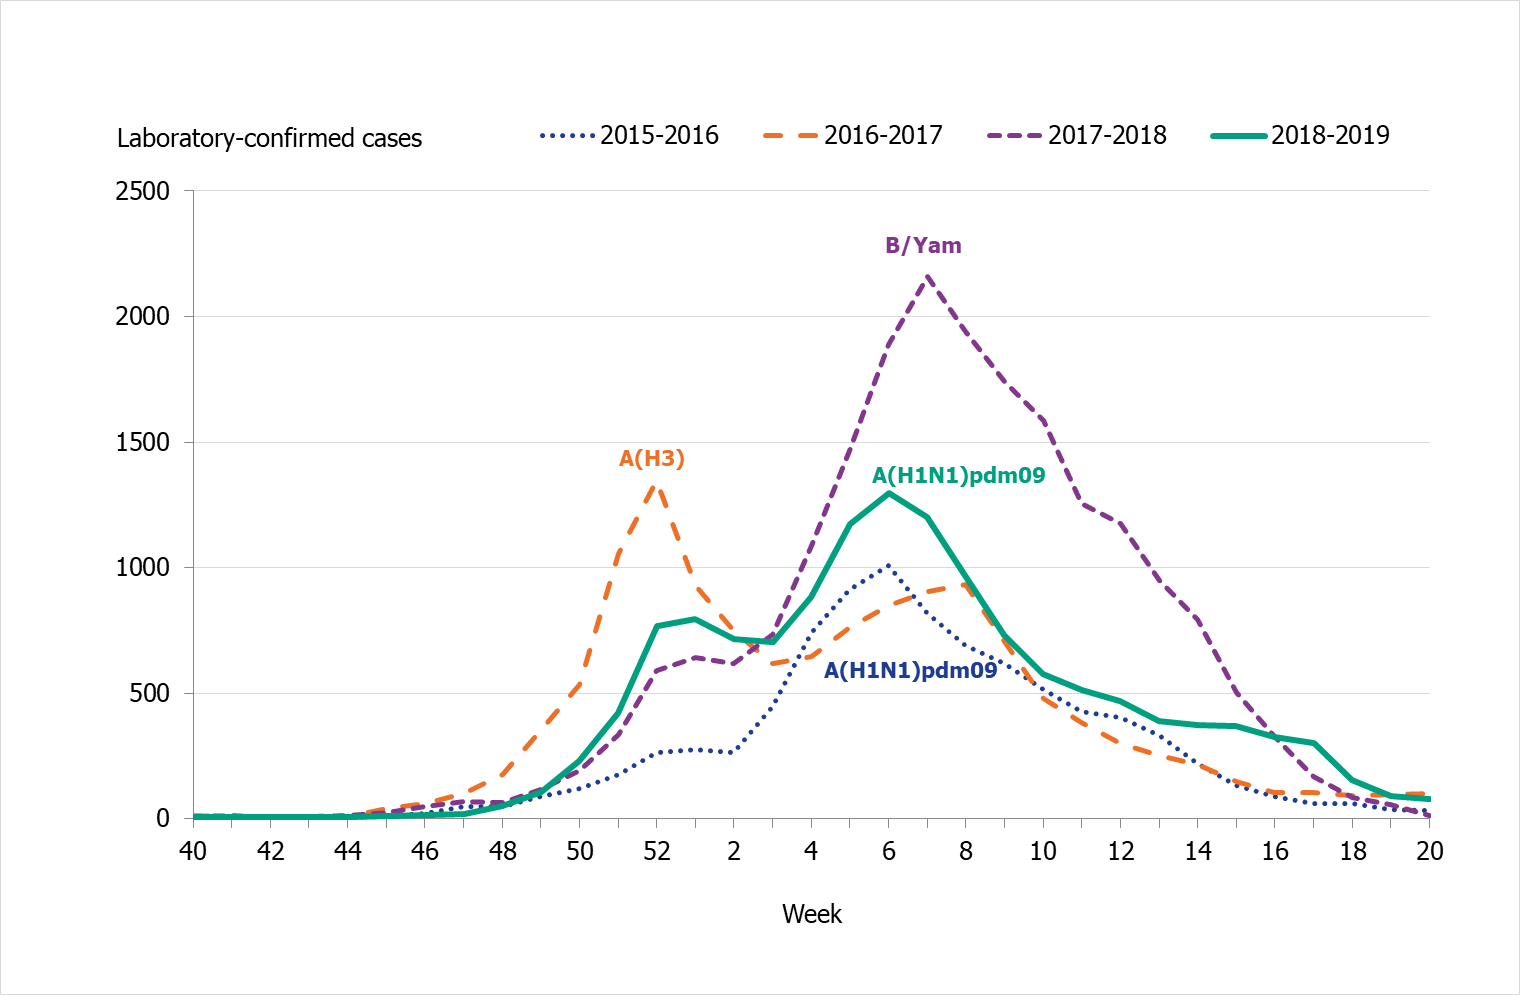
Figure 3. Percentage of samples testing positive for influenza, per week, 2015–2019.
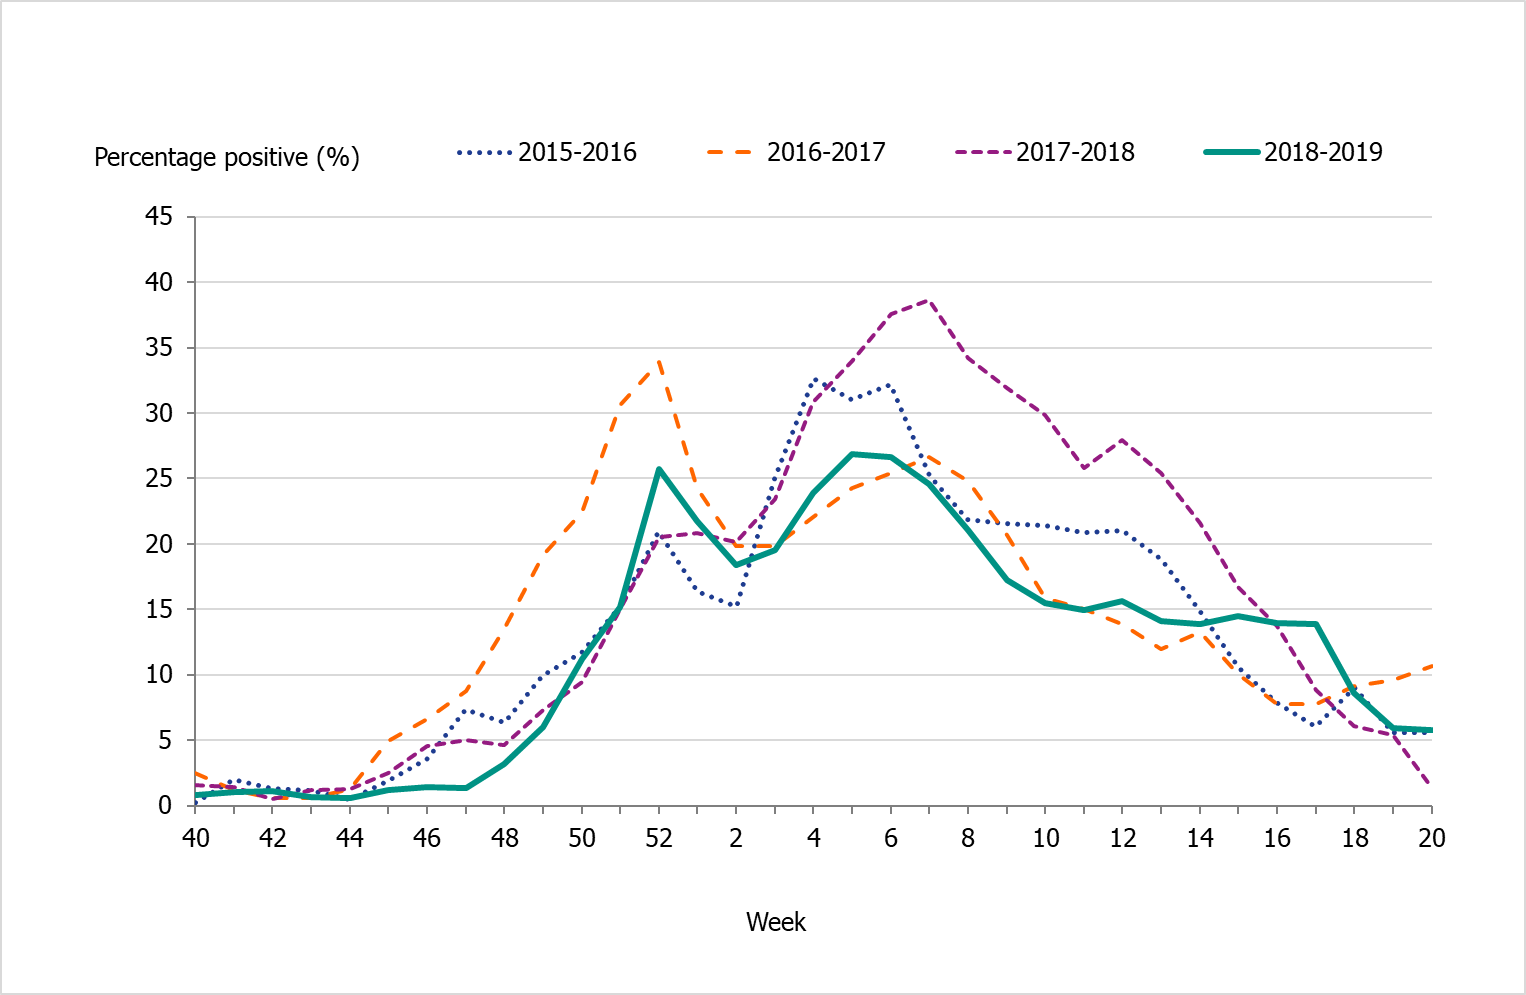
Figure 4. Number of laboratory-confirmed influenza cases stratified by level of care at sampling, 2015–2016 to 2018–2019.
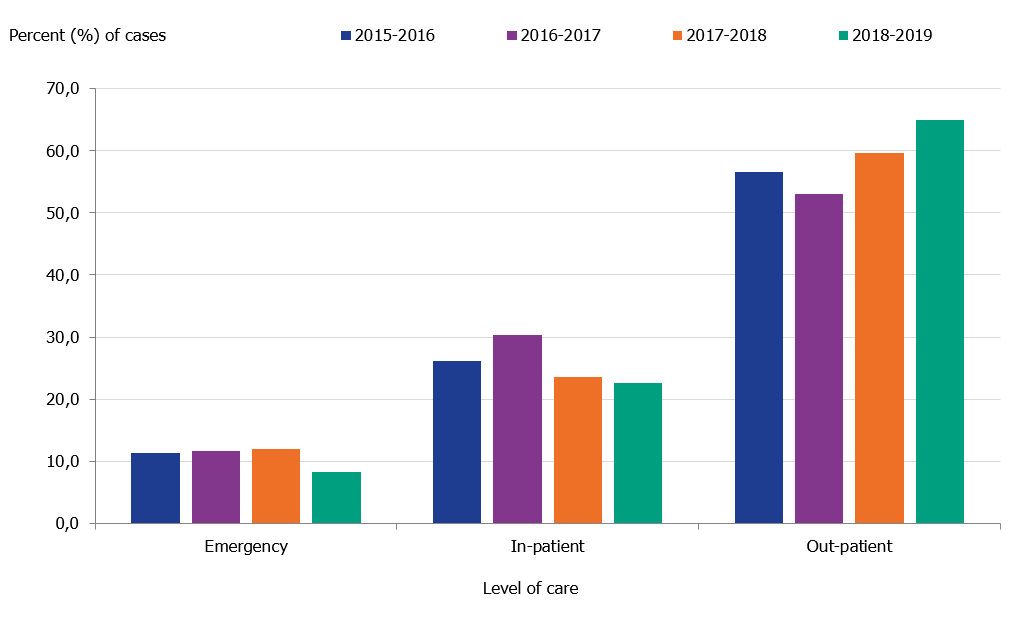
Level of care could not be determined for a small number of cases, which have been excluded.
Viral distribution
During the 2018–2019 season, 13,757 laboratory confirmed cases were reported, almost exclusively influenza A (>99 percent). Very few cases of influenza B were reported (93 cases). Of the subtyped influenza A-positive samples, 63% were A(H1N1)pdm09 and 37% were A(H3N2). Samples of influenza B assigned to a lineage were 50% B/Yamagata and 40% B/Victoria (see also the Subtyping and lineage determination section). Table 3 summarises the laboratory reporting results over the last five seasons, including the number of analysed samples and the proportion of positive samples as well as the total samples positive by type, subtype, and lineage.
| 2015–2016 | 2016–2017 | 2017–2018 | 2018–2019 | |
|---|---|---|---|---|
| Analysed samples | 48,135 | 68,241 | 88,837 | 83,325 |
| Proportion positive samples | 19% | 19% | 23% | 17% |
| Total positive for influenza A | 6,730 | 12,361 | 7,406 | 13,664 |
| A(H1N1)pdm09 * | 2,031 | 14 | 294 | 1,228 |
| A(H3N2) | 112 | 2,061 | 556 | 721 |
| A, not subtyped** | 4,587 | 10,286 | 6,556 | 11,715 |
| Total positive for influenza B | 2,409 | 708 | 13,280 | 93 |
| B/Victoria lineage*** | 65 | 11 | 0 | 4 |
| B/Yamagata lineage*** | 6 | 30 | 144 | 4 |
| B, not typed to any lineage | 2,338 | 667 | 13,136 | 85 |
* Not typed as N1, but classified as A(H1N1)pdm09 based on H1 typing.
** For the period 2013–2015, influenza A cases not subtyped but A(H1N1)pdm09 negative were considered to be influenza A(H3N2) cases. Data on subtype for the 2015–2016 and 2016–2017 seasons are from the Public Health Agency and the three regional laboratories that regularly perform subtyping.
*** All typing for lineage was performed at the Public Health Agency laboratory.
Age and sex distribution
During the 2018–2019 season, the majority (69 percent) of the laboratory-confirmed influenza cases were among individuals aged 40 years and older (Table 4). Young children have been affected by influenza to a greater extent this current season in comparison to previous ones (Figure 5). Because influenza A(H1N1)pdm09 has not circulated since 2015–2016, the youngest cohorts of children had not previously been infected by the virus. Children infected by influenza, however, usually recover at home and do not need to seek medical care for influenza. The age distribution of the laboratory-confirmed cases thus only reflects the burden in terms of children who have sought care for their influenza infection.
The age distributions in 2015–2016 and 2018–2019 were similar, with individuals aged 65 and older and children being the most affected (see Figure 6).
Those aged 65 years and over had the highest cumulative incidence with 300 cases per 100,000 individuals, followed by children aged 0–4 years with a cumulative incidence of 203 cases per 100,000 individuals (see Table 5). Since the pandemic in 2009, the age distribution has shifted and an increasing proportion of the elderly have been affected by influenza A(H1N1)pdm09. In week 10, as the dominance shifted from A(H1N1)pdm09 to A(H3N2), the incidence among the elderly was elevated for a long period and decreased much slower compared to younger age groups. The cumulative incidence for individuals aged 65 and older was lower compared to the two previous seasons (2016–2017 and 2017–2018) when influenza A(H3N2) and influenza B/Yamagata circulated, respectively (Figure 7).
The median age for individuals with laboratory-confirmed influenza A was 60 years, which was higher than 2015–2016, for which the median age was 48 years (see Table 6). Significantly more women (52%) than men (48%) had laboratory-confirmed influenza (p < 0.001).
Few cases (
Figure 5. Weekly incidence of influenza (dominating type) for children aged 0–4 years in Sweden, 2014–2019 seasons.
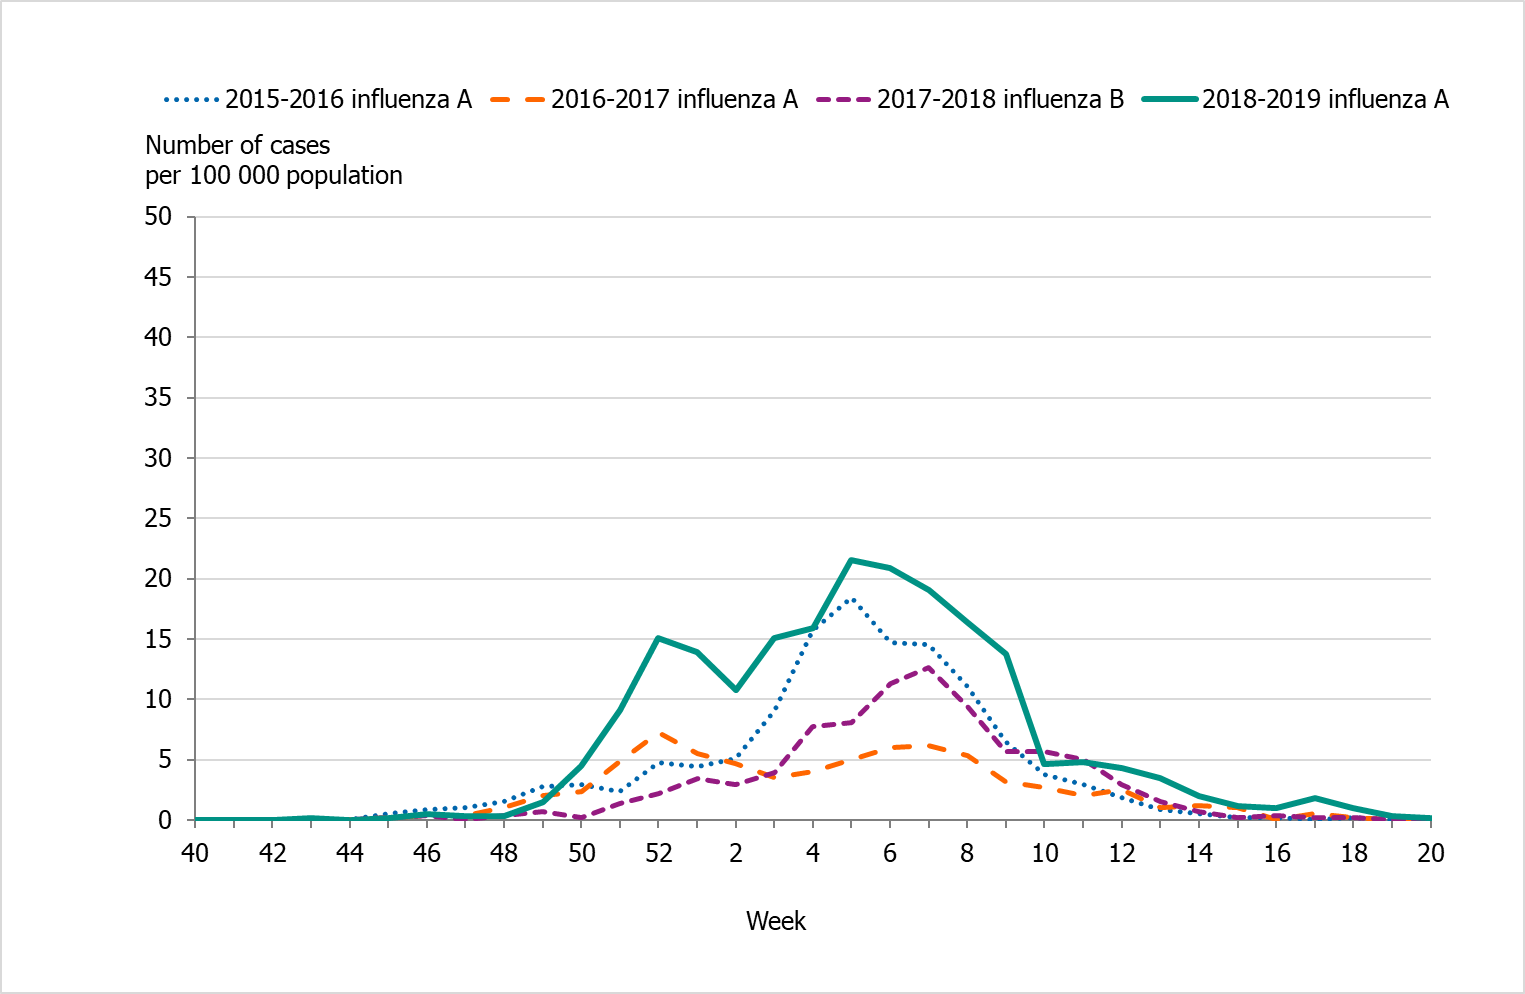
Figure 6. Weekly incidence of influenza A per age group in Sweden, 2018–2019 season.
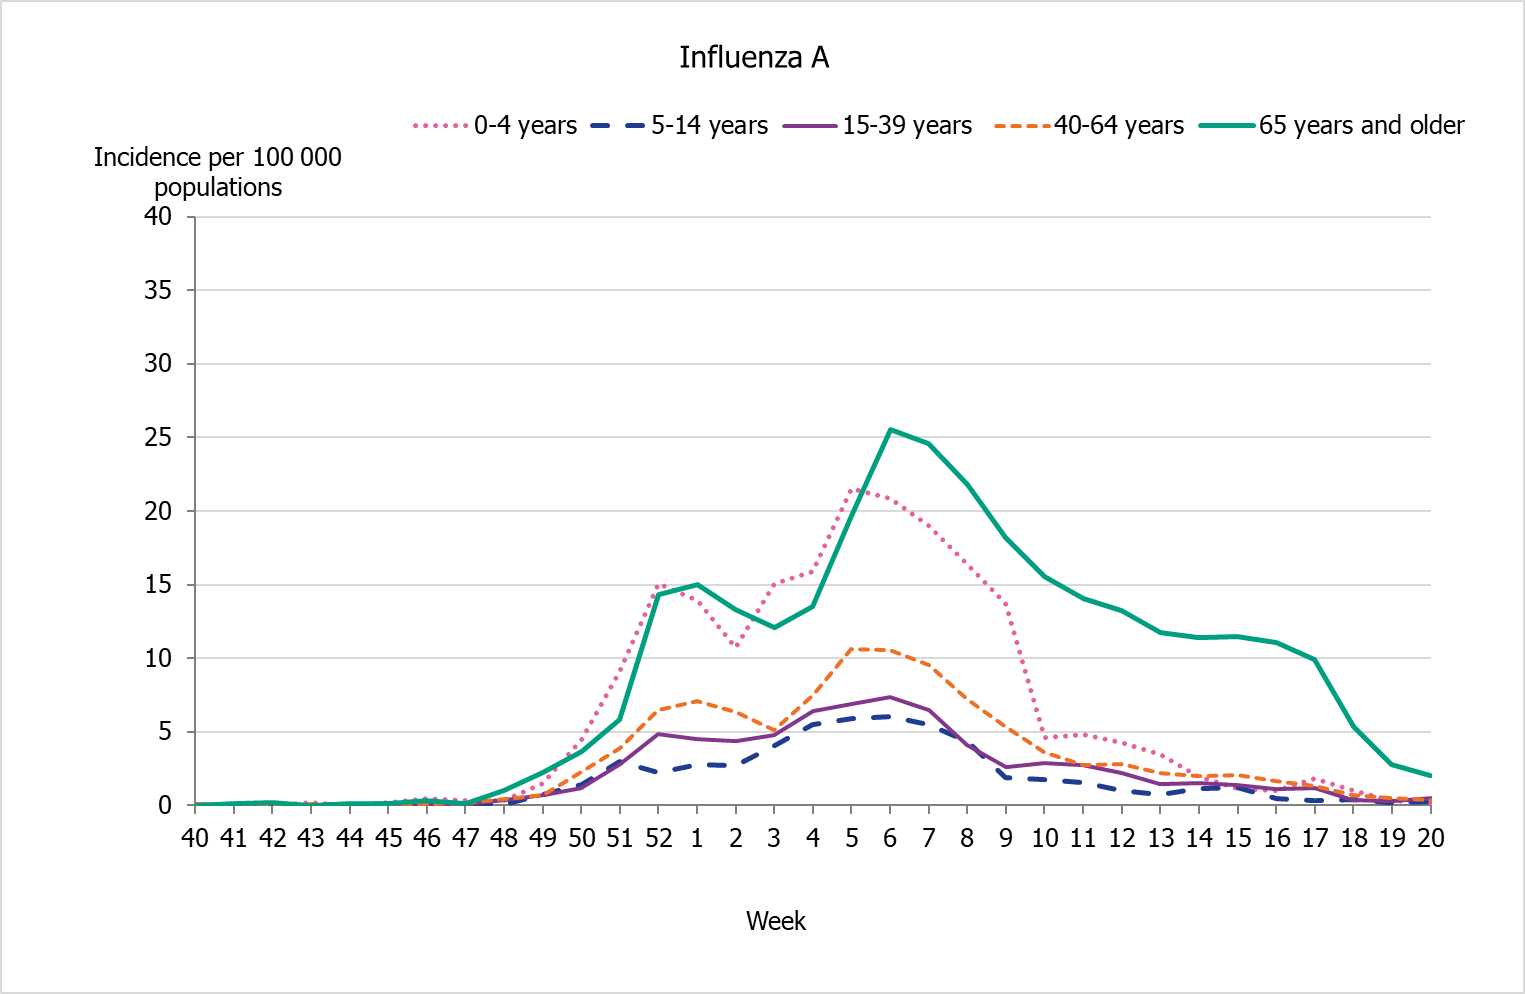
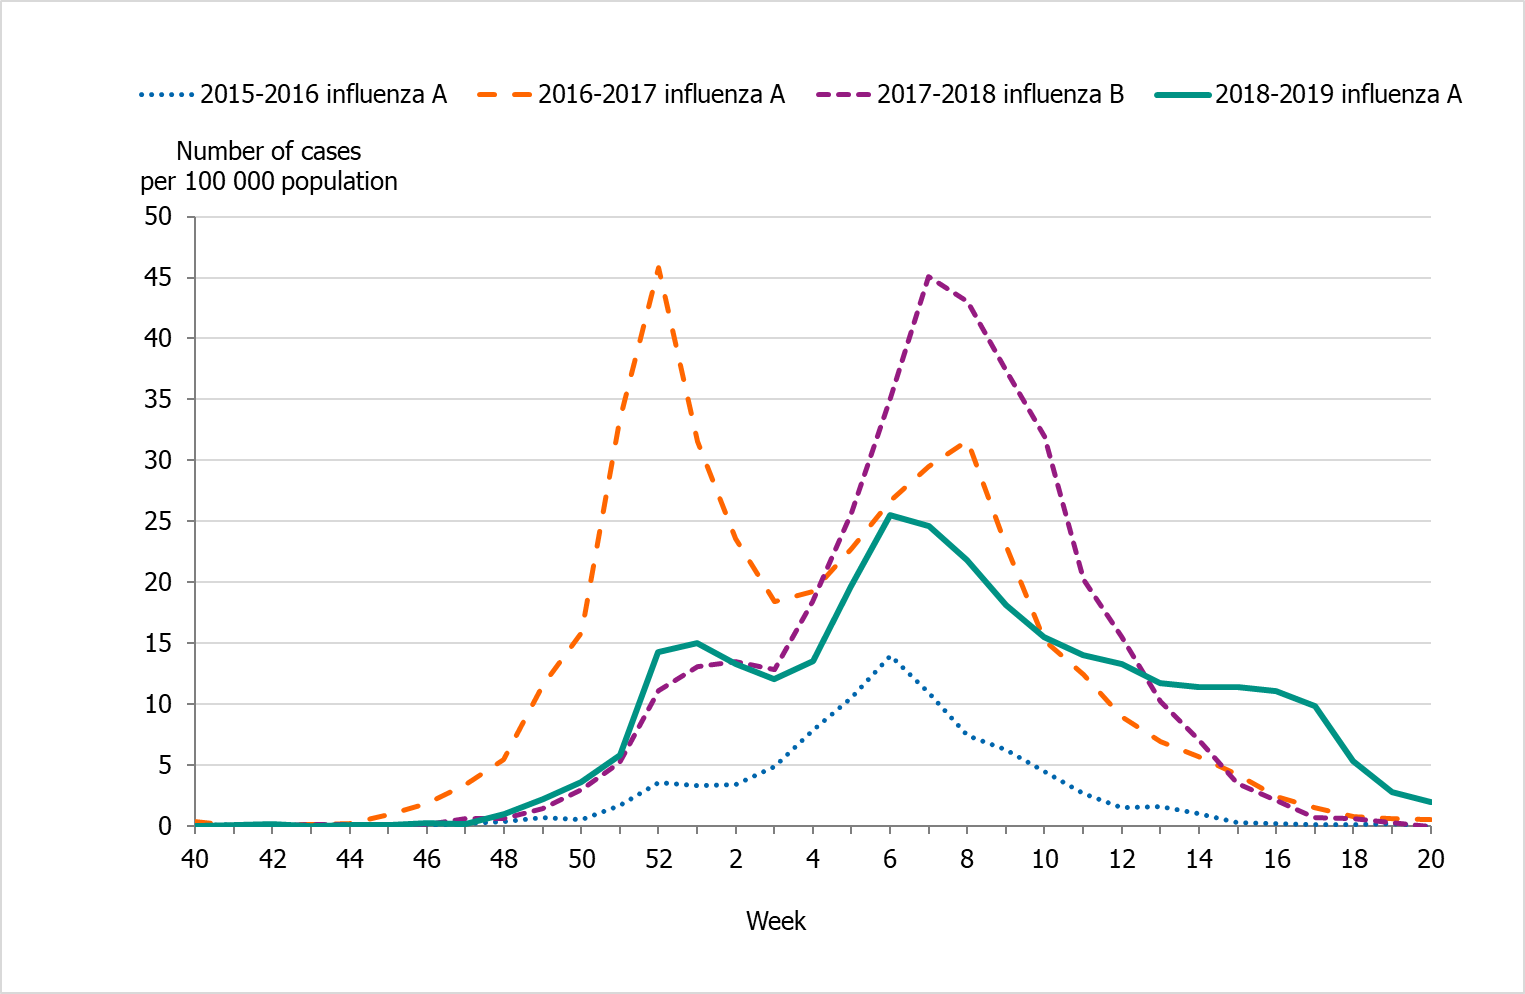
Figure 7. Weekly incidence of influenza (dominating type) for individuals aged 65 and older in Sweden, 2014–2019 seasons.
| 2015–2016 | 2018–2019 | |||
|---|---|---|---|---|
| Age group | Incidence | Percentage | Incidence | Percentage |
| 0–4 | 130.3 | 11% | 203.3 | 9% |
| 5–14 | 26.2 | 4% | 55.4 | 5% |
| 15–39 | 53.3 | 25% | 73.4 | 17% |
| 40–64 | 71.2 | 33% | 103.7 | 24% |
| 65+ | 92.9 | 27% | 300.1 | 45% |
| Total | 68.2 | 100% | 134.8 | 100% |
| Note: Data do not include sentinel cases or cases where the age is unknown. | ||||
| Age group | Population ‡ | Influenza A | Influenza B | ||
|---|---|---|---|---|---|
| Cases | Incidence | Cases | Incidence | ||
| 0–4 | 604,498 | 1,229 | 203.3 | 9 | 1.5 |
| 5–14 | 1,215,231 | 673 | 55.4 | 10 | 0.8 |
| 15–39 | 3,228,688 | 2371 | 73.4 | 28 | 0.9 |
| 40–64 | 3,146,057 | 3,261 | 103.7 | 14 | 0.4 |
| 65–69 | 549,311 | 884 | 160.9 | 7 | 1.3 |
| 70–74 | 563,648 | 1,267 | 224.8 | 6 | 1.1 |
| 75–79 | 400,619 | 1,168 | 291.5 | 7 | 1.7 |
| 80–84 | 261,527 | 1,135 | 434.0 | 3 | 1.1 |
| 85–89 | 162,303 | 972 | 598.9 | 5 | 3.1 |
| 90–94 | 76,247 | 539 | 706.9 | 3 | 3.9 |
| ≥95 | 22,056 | 145 | 657.4 | 0 | 0.0 |
| Total | 10,230,185 | 13,644 | 405.3 | 92 | 15.2 |
*The table does not include sentinel cases or cases where age is unknown.
‡ Population on December 31, 2018. Source: Statistics Sweden, Statistikdatabasen.
| 2015–2016 | 2016–2017 | 2017–2018 | 2018–2019 | |
|---|---|---|---|---|
| Influenza A | 48 | 74 | 70 | 60 |
| Influenza B | 33 | 58 | 68 | 37 |
Geographic distribution
During the initial weeks of the epidemic, the northern parts of Sweden (Norrland) had higher incidence in comparison to the middle (Svealand) and southern (Götaland) parts of the country (Figures 8 and 9). During the Christmas and New Year holidays (weeks 52), the incidence reached a first peak for the northern parts of the country (Norrland), and then a second peak was seen in week 7. The incidence in the middle (Svealand) and southern (Götaland) parts of the country peaked in weeks 5 and 6, respectively. The percentage of samples positive for influenza showed a similar geographic trend with peaks in weeks 1–2 and 7 for the northern part of the country (Norrland), weeks 6–7 for the middle (Svealand) and southern (Götaland) parts of the country.
Altogether, the northern parts of the country (Norrland) had the highest cumulative incidence of laboratory-confirmed cases per 100,000 individuals this season, with 162 cases, followed by the middle parts (Svealand) with 149 cases and the southern parts (Götaland) with 116 cases. The greatest numbers of cases were reported from the largest urban areas (Stockholm, Västra Götaland, and Skåne). However, in relation to population size, some smaller counties had a higher cumulative incidence. The number of laboratory-confirmed cases might be affected by healthcare-seeking behaviour as well as differences in sampling in the various regions; thus, no direct conclusions can be drawn regarding actual influenza activity using the measured incidence.
Figure 8. Weekly incidence of laboratory-confirmed influenza per 100,000 population and county from week 40, 2018, to week 20, 2019. Note: The colour scale indicates the incidence. The scale has been changed from the previous season.
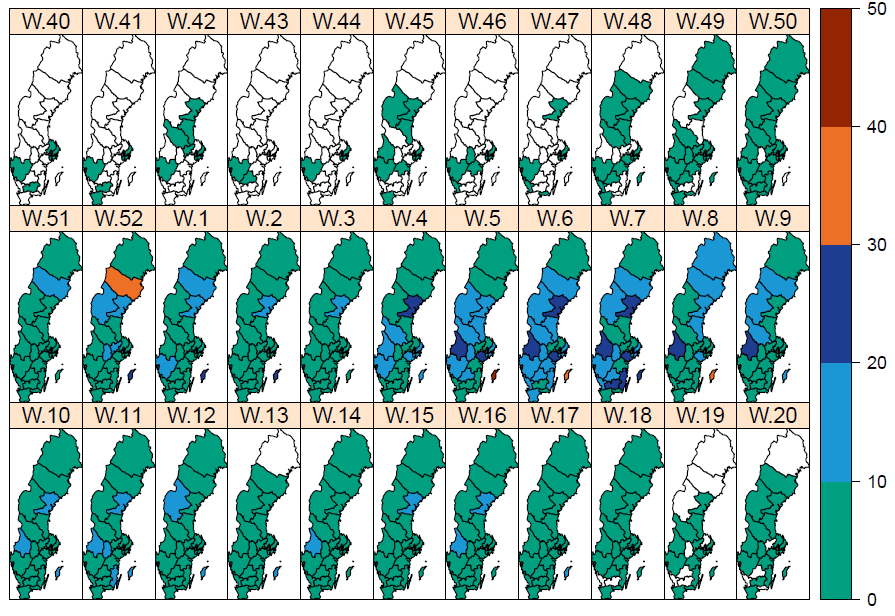
Figure 9. Weekly incidence of laboratory-confirmed influenza per 100,000 population and county from week 40, 2018, to week 20, 2019.
Antiviral sales
Every Monday, the Public Health Agency receives data from the Swedish eHealth Agency on the previous week's sales of the antivirals zanamivir and oseltamivir. Data include all sales categories, i.e. prescriptions and healthcare requisitions. The number of prescriptions directly reflects patients seeking medical care for influenza-like symptoms, whereas requisitions more likely show medical staff preparations for intense periods as well as reflect patients currently in treatment.
Cumulative sales of antiviral medications were at approximately the same level in the 2018–2019 season as in the 2016–2017 season, similar to the pattern seen in laboratory-confirmed cases. During the 2018–2019 season, sales first increased steeply to their highest value toward the end of December (week 51), ahead of the Christmas holidays, at the same time as the number of influenza cases increased significantly. This increase primarily reflected increased requisitions from hospitals. After this high value, sales followed the pattern of influenza cases and increased again to another, broader peak around the influenza peak at week 6.
During the 2018–2019 season, sales of antivirals were higher than the number of influenza cases (Table 7). Antiviral sales might be increasing (when compared to influenza cases) partly due to increased efforts by several county councils to make rapid and reliable influenza diagnostics available, meaning doctors have the opportunity to start antiviral treatment quickly and thus with better treatment effects.
| 2014–2015 | 2015–2016 | 2016–2017 | 2017–2018 | 2018–2019 | |
|---|---|---|---|---|---|
| Prescriptions | 3,610 | 3,720 | 4,806 | 7,371 | 6,081 |
| Health care requisitions | 5,389 | 4,930 | 10,262 | 13,195 | 10,534 |
| Total sales | 8,999 | 8,650 | 15,068 | 20,566 | 16,615 |
| Total influenza cases | 10,389 | 9,134 | 13,069 | 20,686 | 13,757 |
Influenza cases in intensive care
The Public Health Agency receives anonymised data daily on influenza patients in intensive care through a collaboration with the Swedish Intensive Care Registry (SIR). A special influenza module in the registry, known as SIRI, allows the treating physician at an intensive care unit to report underlying medical conditions, complications, antiviral treatment, vaccination status, influenza type and subtype, and other data for patients under treatment.
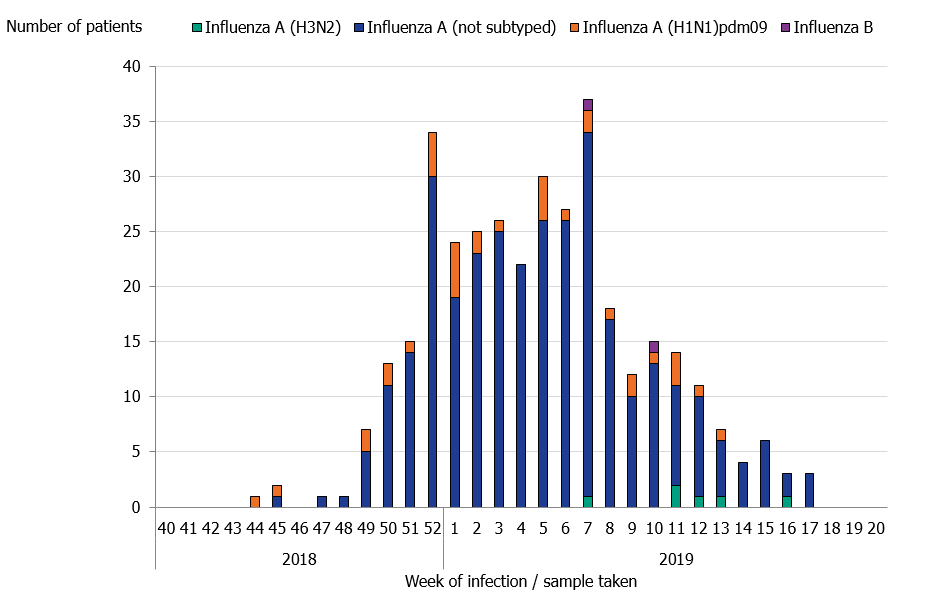
During the 2018–2019 season, 359 patients with influenza were reported as having received intensive care. The majority of the cases had influenza A (357 patients), while only 2 patients had influenza B (Table 8 and Figure 10). Of patients with influenza A and reported subtype, 35 patients had influenza A(H1N1)pdm09 and 6 patients had influenza A(H3N2). The greatest number of patients were admitted to intensive care during week 7 (36 patients), which is the week after the laboratory-confirmed cases of influenza peaked. A large number of patients (34 patients) were also admitted to intensive care in week 52, at the start of the seasonal epidemic. The age distribution of patients in intensive care was similar to the 2015–2016 season, which was also dominated by influenza A(H1N1)pdm09, but the proportion of patients 65 years and older was higher. Individuals aged 65 years and older were the most affected age group in 2018–2019 (171 patients), followed by the age group 40–64 years (130 patients). The median age for patients with influenza A was 64 years. There was no significant difference in sex distribution.
Of all reported cases in intensive care, 265 patients (74 percent) were in a risk group for severe influenza illness, either due to age (65 years and older) or due to having one or more medical risk factors. Among patients under the age of 65 years, more than half (94 patients, 51%) did not have a medical risk factor for severe influenza, which was similar to the 2015–2016 season (47%). As in the previous two seasons, chronic heart-lung disease (n = 135), immunosuppression (n = 58), and chronic liver/kidney disease (n = 31) were the most commonly reported risk factors in the 2018–2019 season. Two of the patients with influenza A were pregnant.
Of the patients who were recommended vaccination, vaccination status was known for 116 patients, of which 34 (29 percent) were vaccinated. In addition, four patients without any reported risk factor were vaccinated. All vaccinated patients (38 patients) had influenza A. The age for vaccinated patients ranged from 2 to 84 years, with a median age of 70 years. The majority of the vaccinated patients were aged 65 years and older (28 patients).
Information regarding primary diagnosis in intensive care was reported for 330 patients. Influenza with pneumonia (n = 117), influenza with other respiratory complications (n = 35), and bacterial pneumonia (n = 20) were the most common primary diagnoses for intensive care.
Of the patients requiring intensive care, 94 individuals were reported to have died. The majority (84 percent) of the deceased had a medical risk factor or were aged 65 years or older and therefore were at increased risk of severe influenza infection. The median age patients who died was 69 years.
Figure 10. Number of patients with influenza in intensive care by influenza type or subtype, 2018–2019 season.
| 2015–2016 | 2016–2017 | 2017–2018 | 2018-2019 | |
|---|---|---|---|---|
| Cases (median age) | ||||
| Influenza A (not subtyped) |
157 (56) | 196 (73) | 136 (64) | 357 (64) |
| Influenza A(H1N1)pdm09 | 156 (58) | 3 (82) | 9 (59) | 35 (64) |
| Influenza A(H3N2) | 4 (56) | 50 (72) | 14 (72) | 6 (66) |
| Influenza B | 50 (52) | 9 (66) | 288 (67) | 2 (74) |
Number of intensive care patients over time
Most intensive care units (89 units) are connected to SIR and as such are able to report to the influenza module SIRI, but this reporting is voluntary. Although the number of units registered for reporting with SIR has remained relatively constant during the period 2012–2018, the number of units that have reported to SIRI for at least one season has increased from 19 to about 50 units since SIRI surveillance started in 2012–2013. The largest increase in the number of reporting units occurred in 2015–2016, and since then the number of reporting units has been stable (49–53 units, see Table 9 below). During the 2018–2019 season, 51 units reported to SIRI. The increase in the number of reporting units makes it difficult to compare the crude numbers of patients in intensive care over time.
Incidence of patients in intensive care with influenza
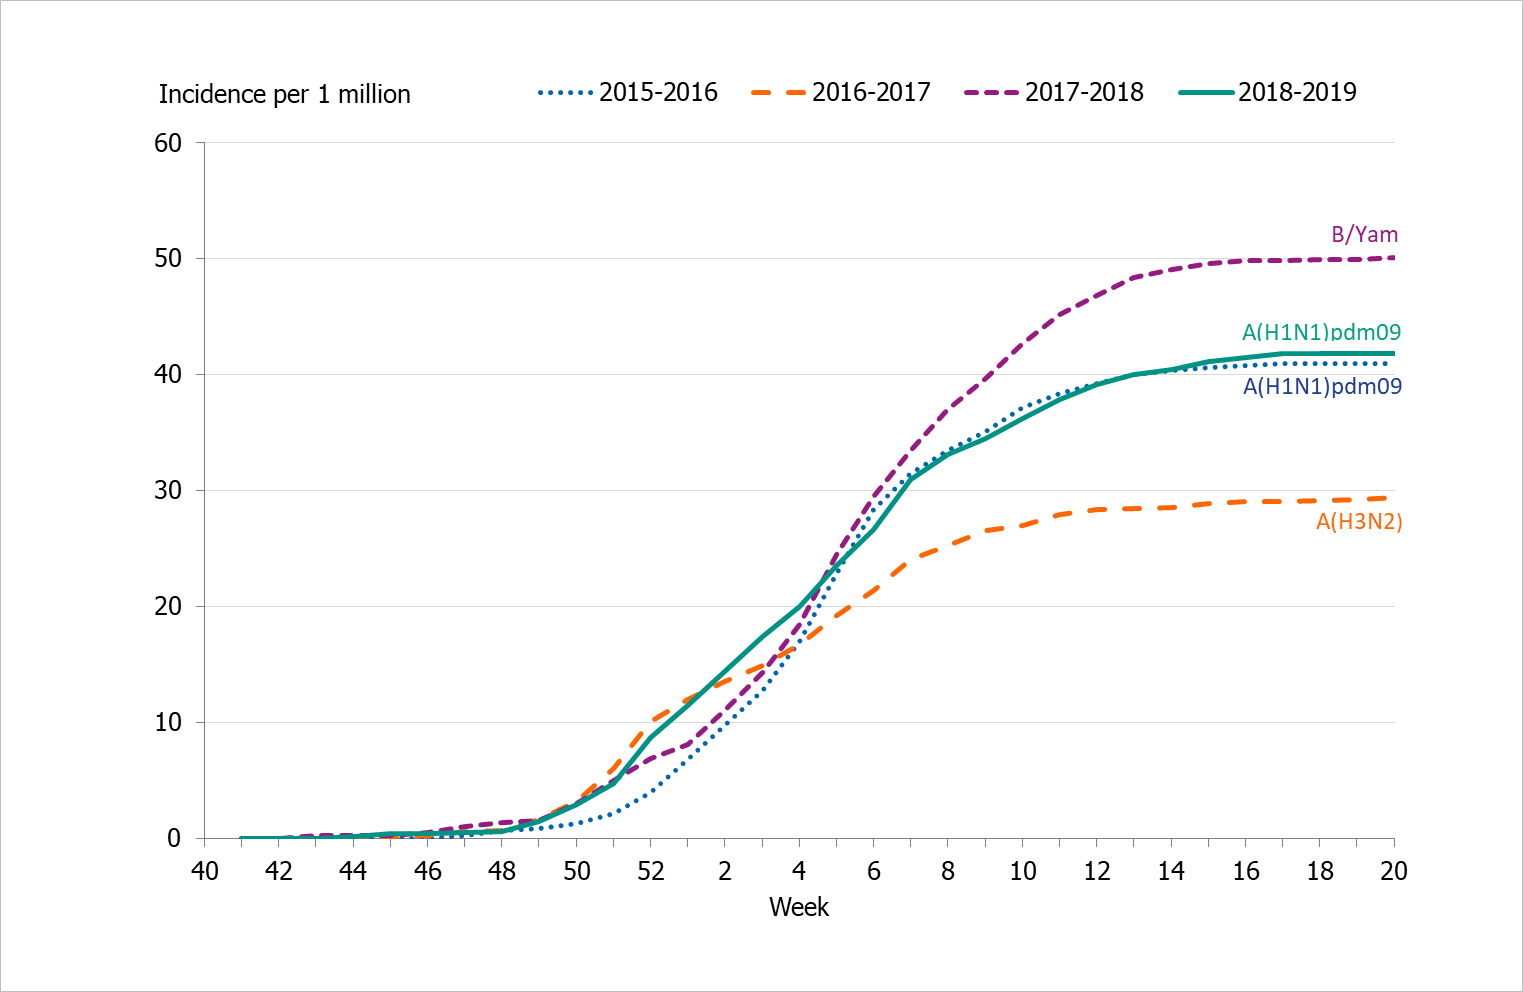
To enable comparison of the past seasons, we have estimated the incidence of patients in intensive care with influenza. The incidence for the last four seasons has been calculated based on preliminary estimates of regional catchment population denominators. When comparing weekly incidence, a higher peak weekly incidence was observed for seasons 2015–2016 and 2017–2018, whereas season 2016–2017 and 2018–2019 had a higher weekly incidence at the start of the epidemic and then were more stable or even decreased (Figure 11). Although different in terms of the distribution of the weekly number of cases, the cumulative incidence was very similar for seasons 2018–2019 and 2015–2016, when influenza A(H1N1)pdm09 also dominated (Table 9, Figure 12). As shown, season 2017–2018, which was dominated by influenza B/Yamagata, had the highest cumulative incidence, whereas 2016–2017 had lower incidence and was a season dominated by influenza A(H3N2).
| 2015–2016 | 2016–2017 | 2017–2018 | 2018-2019 | |
|---|---|---|---|---|
| Total number of patients | 367 | 258 | 447 | 359 |
| Cumulative incidence per 1 million population* | 40.9 | 29.4 | 50.1 | 41.9 |
| Reporting ICUs | 53 | 49 | 53 | 51 |
| *Incidence calculations use preliminary estimates of regional catchment population denominators for each region based on information about which ICUs have reported each season. | ||||
Figure 11. Weekly incidence of patients with influenza in intensive care, last four seasons, 2015–2019.
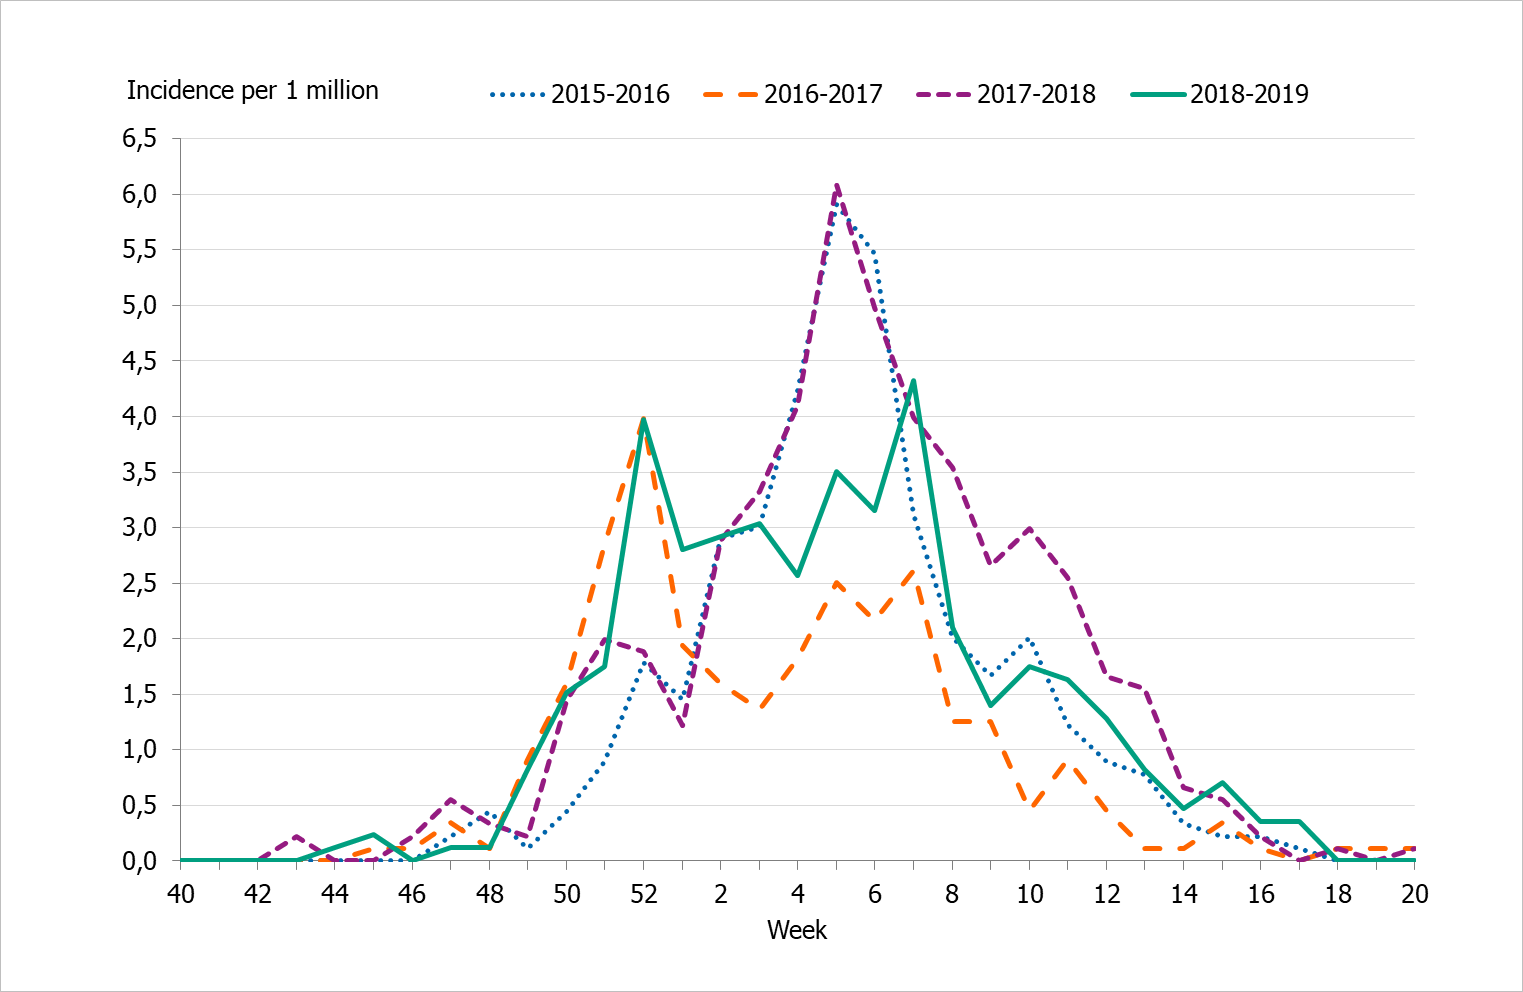
Figure 12. Cumulative incidence of patients with influenza in intensive care per week, last four seasons, 2015–2019.
Influenza-related mortality
Influenza-related mortality is often noted during influenza seasons and varies with circulating strains and the intensity of the season. The Public Health Agency uses different systems to measure influenza-related mortality.
Data on laboratory-confirmed influenza patients are intermittently linked to Swedish Tax Agency data on death in order to identify deceased individuals and to retrieve their dates of death. If 30 days or less have elapsed since the influenza diagnosis, the death is considered to be influenza related. This measurement is not specific nor is it sensitive. It is imprecise because a death within 30 days might have been caused by something else, and it is not sensitive because this measure does not include deaths if the diagnosis of influenza was not laboratory confirmed. Therefore, there are most likely a large number of unrecorded deaths from influenza. In addition, the data do not include information about underlying risk factors or complications of influenza infection.
To better estimate mortality, two models are used to identify crude and influenza-related excess mortality during the influenza season using the aggregate number of deaths. The EuroMoMo model estimates the crude excess mortality for the whole country by age group and regionally. The FluMoMo model estimates excess mortality due to either influenza activity or extreme temperatures, both nationally and by age group.
Deaths 30 days after influenza diagnosis
In total, 505 of 13,324 persons who received a laboratory-confirmed influenza diagnosis during the 2018–2019 season died within 30 days of diagnosis. Of these, all but four had an influenza A diagnosis. Most samples of influenza A and B were not analysed for subtype or lineage, respectively. Within the 30 days, most (75 percent) of those who died did so within 15 days of diagnosis.
Patients who died ranged in age from 0 to 100 years, with a median age of 81 years of age. Patients who had not died within 30 days of diagnosis had a median age of 59 years. In total, 88 percent of deaths within 30 days occurred among people aged 65 years and older. Ten percent of deaths occurred among adults aged 40–64 years and two percent occurred in people under the age of 40 years. The age distribution reflects the circulation of influenza A(H1N1)pdm09 and the lower mortality burden seen among the elderly this season.
Overall, 7 percent of those aged 65 years and older who received a laboratory-confirmed influenza A diagnosis died within 30 days. Table 10 shows that the proportion of deaths within 30 days increased with increasing age and varied from 0.2 percent for persons aged under 40 years to 23% for people aged 95 years and older. The analyses were not been adjusted for expected mortality per age group.
| <40 years | 40–64 years |
65–69 years |
70–74 years |
75–79 years |
80–84 years |
85–89 years |
90–94 years |
≥95 years |
Total | |
|---|---|---|---|---|---|---|---|---|---|---|
| Total Cases | 4,142 | 3,174 | 859 | 1,238 | 1,151 | 1,119 | 963 | 536 | 142 | 13,324 |
| Cases/100,000 | 82 | 101 | 156 | 220 | 287 | 428 | 593 | 703 | 644 | 3,214 |
| Total Deaths | 10 | 53 | 25 | 66 | 79 | 98 | 79 | 63 | 32 | 505 |
| Deaths/100,000 | 0.2 | 2 | 5 | 12 | 20 | 37 | 49 | 83 | 145 | 352 |
| Deaths among cases (%) | 0.2% | 2% | 3% | 5% | 7% | 9% | 8% | 12% | 23% | 3.8% |
| This analysis includes all laboratory-confirmed influenza cases from week 40, 2018, to week 20, 2019. It excludes 918 patients whose personal identification number was not included in the case report, meaning that their status at 30 days could not be ascertained. | ||||||||||
Excess mortality
No significant influenza-related or all-cause excess mortality was seen in any age group or in the total population during the 2018–2019 season according to the FluMoMo model (Figure 13). According to the EuroMoMo model, all-cause excess mortality was minimal in all areas of the country, except for a small peak in week 1, 2019, in northern Sweden.
Influenza-related excess mortality is most frequently noted in the age group 65 years and older, primarily in seasons dominated by influenza A(H3N2). Because the season was primarily dominated by influenza A(H1N1)pdm09 and only reached medium intensity, excess mortality this season was lower than during any A(H3N2) season and lower than the 2017–2018 season, which was dominated by influenza B/Yamagata. The cumulative total influenza-related excess mortality (the area under the red line in the diagram) was similar to the 2015–2016 season – the last season when A(H1N1)pdm09 dominated. The elderly have a certain level of immunity to this type of influenza. The later part of the 2018–2019 season, when influenza A(H3N2) dominated, was at low intensity.
At the European level, excess mortality has been reported among those aged 15–64 years and 65 years and older (see EuroMoMo project (10)), which might reflect differences in circulating virus subtypes throughout the region.
Figure 13. Number of deaths per week (grey), influenza-related excess mortality (red), and temperature-related excess mortality (green) in each age group and in total, Sweden, 2014–2019 (week 23).
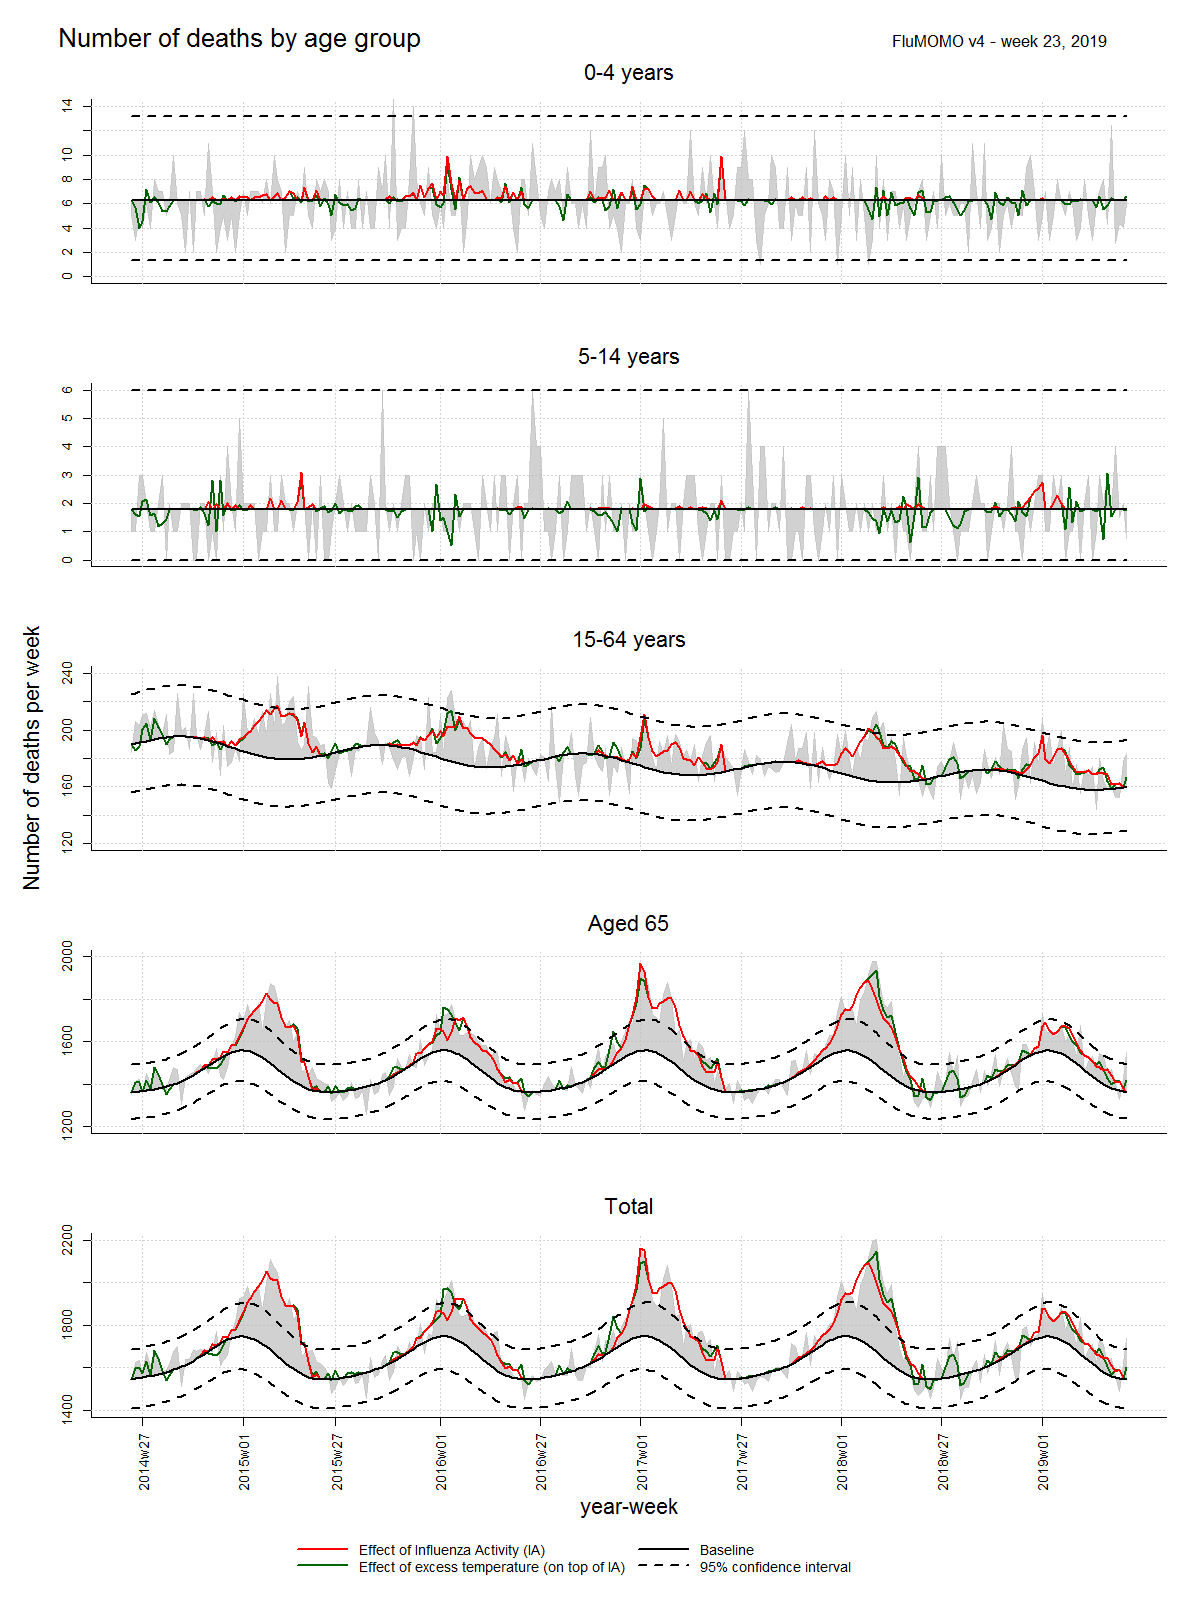
Note: The expected numbers of deaths are shown in black, the actual numbers of deaths in grey, influenza-related excess mortality in red, and temperature-related excess mortality in green, as estimated by the FluMoMo model. Some variation in the number of deaths is expected week to week, which is illustrated with the dashed lines marking two standard deviations around the estimated number of expected deaths per week. Estimated excess mortality exceeding these boundaries is considered a significantly elevated excess mortality.
Sentinel sampling
Virological analysis of samples from sentinel general practitioners, infectious disease clinics, and paediatric clinics contributes to national and international surveillance of circulating influenza viruses. In order to estimate what proportion of the patients seeking care for ILI actually has influenza, the different clinics are encouraged to collect nasal samples from patients with ILI. Patient characteristics, including age, sex, risk factors, syndrome (ILI vs. ARI), and vaccination status, are analysed with respect to the types of influenza that are circulating. The Public Health Agency carries out laboratory analyses for influenza free of charge for these samples. Representative positive samples are also used to characterise the circulating strains of influenza.
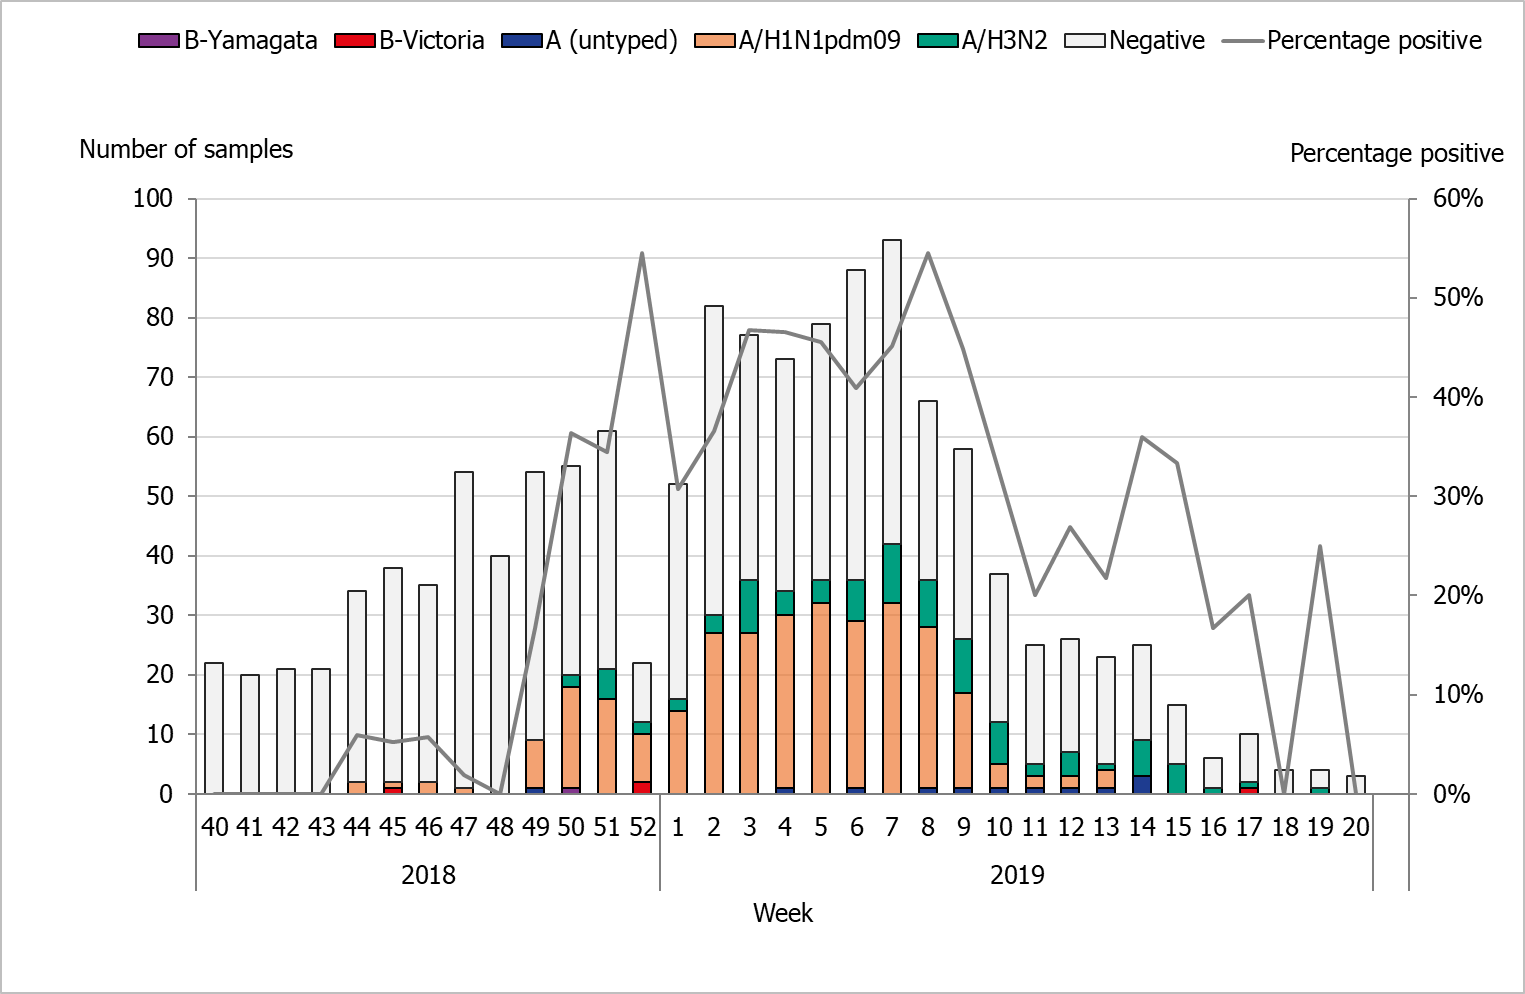
During the 2018–2019 season, 1,323 sentinel samples were submitted from 73 participants, including 68 general practitioners and 5 paediatric or infectious disease clinics. Eighty-eight percent of the samples were collected by general practitioners. In total, 408 samples (31%) tested positive for influenza. Figure 14 shows the distribution of samples taken and the positive samples by subtype/lineage.
Of the positive samples, 403 (99%) were positive for influenza A and 5 (1%) were positive for influenza B. Of the subtyped influenza A-positive samples, 299 (74%) were influenza A(H1N1)pdm09 and 92 (26%) were influenza A(H3N2). Twelve influenza A samples (3%) could not be subtyped due to low virus concentration. In total, five samples were positive for influenza B. Of these, four samples belonged to the B/Victoria/2/87 lineage and one belonged to the B/Yamagata/16/88 lineage.
Figure 14. Number of sentinel samples submitted each week, number of samples by subtype/lineage, and the percentage positive, 2018–2019.
Clinical features
Of the 1,323 patients sampled through the sentinel system with known symptoms, 92 percent had ILI (Table 11) and 8 percent had ARI. In total, 56 percent of the samples came from women. Twenty-two percent of the samples were collected from patients belonging to a risk group due to age and/or medical condition. Of these, 59 percent were aged 65 years or older. The most common reported medical risk factors were lung disease (n = 52), diabetes (n = 49), heart disease (n = 45), immunocompromised, (n = 22), and pregnancy (n = 12).
| Season 2016–2017 | Season 2017–2018 | Season 2018–2019 | |||||||
|---|---|---|---|---|---|---|---|---|---|
| Number | Median age | ILI | Number | Median age | ILI | Number | Median age | ILI | |
| Analysed | 1,120 | 36 | 85% | 1,616 | 42,5 | 85% | 1,323 | 41 | 92% |
| Negative | 887 | 1075 | 915 | ||||||
| Proportion positive | 21% | 33% | 31% | ||||||
| Positive for influenza A | 227 | 124 | 403 | ||||||
| A(H1N1)pdm09 | 2 | 27 | 100% | 28 | 35 | 71% | 299 | 38 | 95% |
| A(H3N2) | 213 | 34 | 90% | 87 | 43 | 85% | 92 | 38 | 96% |
| A, not subtyped | 12 | 35 | 93% | 9 | 50 | 89% | 12 | 53 | 73% |
| Positive for influenza B | 6 | 417 | 5 | ||||||
| B/Victoria | 2 | 4 | 100% | 1 | * | 100% | 4 | 13 | 100% |
| B/Yamagata | 3 | 44 | 100% | 415 | 41 | 89% | 1 | * | 100% |
| B, positive for both lineages | 1 | * | 0% | 1 | * | 100% | 0 | - | - |
| *Median age is not shown for single cases. | |||||||||
Influenza infection among vaccinated patients
Vaccination status was reported for 1,287 (97%) of the 1,323 patients sampled during the season. Of these, 134 (10%) were vaccinated. Among the patients belonging to a risk group, 35% were vaccinated. Influenza A was detected among 29 vaccinated patients.
Influenza A(H1N1)pdm09 was detected in 14 patients (median age 64 years), A(H3N2) in 10 patients (median age 60 years), and five patients with non-subtyped influenza A (median age 73 years). Fourteen of the vaccinated patients were aged 65 years and older, and the median age for all vaccinated was 58 years. Of the 15 patients younger than 65 years of age, six patients belonged to a medical risk group.
The Public Health Agency participates in the European Influenza Monitoring Vaccine Effectiveness (I-MOVE) network with data from Swedish sentinel sampling. In the interim report for the 2018–2019 season, the vaccination effect was good for A(H1N1)pdm09 (45 to 71 percent) and low for A(H3N2) (<0 to 24 percent) (2). there were too few influenza b strains to determine the vaccination effect.>
Subtyping and lineage determination
All diagnostic laboratories perform influenza typing using molecular assays for influenza A and B. During the 2018–2019 season, subtyping was performed at two regional laboratories (Lund and Göteborg). The Public Health Agency performs subtyping and lineage typing by real-time PCR for all samples sent in from the diagnostic laboratories and on all positive samples from sentinel surveillance.
In total, 1,949 influenza A-positive samples were subtyped during the season, of which 1,228 (63%) were A(H1N1)pdm09) and 721 (37%) were A(H3N2).
The lineage was determined for eight influenza B-positive samples. Four belonged to the B/Yamagata lineage and four to the B/Victoria lineage. Typing results for subtype and lineage from sentinel and laboratory reporting systems are presented in Table 12.
| 2015–2016 | 2016–2017 | 2017–2018 | 2018–2019 | |||||
|---|---|---|---|---|---|---|---|---|
| Influenza type | Sentinel | Lab | Sentinel | Lab | Sentinel | Lab | Sentinel | Lab |
| A(H1N1)pdm09 | 70% | 64% | 1% | <1%> | 6% | 13% | 76% | 63% |
| A(H3N2) | 3% | 13% | 96% | >99% | 17% | 23% | 23% | 37% |
| B/Victoria | 24% | 18% | 1% | <1%> | <1%> | <1%> | 1% | <1%> |
| B/Yamagata | 2% | 6% | 2% | <1%> | 77% | 64% | <1%> | <1%> |
Virological analyses
A selection of the influenza-positive samples from laboratories and from the sentinel surveillance programme are further analysed for genotypic features by sequencing and for phenotypic sensitivity to neuraminidase (NA) inhibitors. Samples are selected to be as representative as possible in terms of geographical location, period of collection, and types/subtypes/lineage types. Swedish laboratories are also asked to send influenza-positive samples from severely ill or deceased patients, patients with vaccine break-through infections, and patients who do not respond to antiviral treatment.
The main sequencing technology used is NGS (Next Generation Sequencing), which allows whole genome sequencing of all known influenza A subtypes and both influenza B lineage types. The haemagglutinin (HA) gene is characterised with respect to genetic vaccine similarity, clade affiliation, and changes in receptor affinity (lung receptors versus upper respiratory tract receptors). In addition, the HA target sequences for the subtype/lineage-specific real-time PCR systems used for detection of influenza in clinical samples are analysed for sequence mismatches compared to the real-time PCR primers and probes. The NA gene is analysed with respect to reduced or highly reduced inhibition by NA inhibitors.
In addition to NGS, Sanger sequencing of the NA gene is used for more urgent requests of genotypic antiviral resistance testing. Two aspects of the matrix protein (M) gene are analysed by sequencing, and the M2 gene of influenza A is analysed with respect to resistance to amantadine while the M target sequences of both influenza A and B of the real-time PCR systems are analysed for sequence mismatches.
Phenotypic analysis of sensitivity to the NA inhibitors oseltamivir (Tamiflu®/Ebilfumin®) and zanamivir (Relenza®) is performed with the neuraminidase inhibition (NAI) assay, which requires cell-cultured virus isolated on cell culture.
A representative selection of the isolated virus samples is sent to the WHO CC in London for antigenic characterisation and for phenotypic analysis of sensitivity to NA inhibitors by NAI assay. All characterisation data are reported to TESSy and to the Global Initiative on Sharing All Influenza Data (GISAID).
Characterisation of viruses
Table 13 summarises the number of sequenced genes per subtype/lineage during the 2018–2019 season.
| H | N | M | NS | PB2 | PB1 | NP | PA | |
|---|---|---|---|---|---|---|---|---|
| A(H3N2)/H3* | 96 | 95 | 107 | 101 | 92 | 87 | 95 | 92 |
| A(H1N1)pdm09 | 152 | 157 | 180 | 178 | 139 | 128 | 155 | 138 |
| A(H1N2) reassortant | 1 | 1 | 1 | 1 | 1 | 1 | 1 | 1 |
| B/Yamagata | 2 | 2 | 2 | 2 | 2 | 2 | 2 | 2 |
| B/Victoria | 5 | 5 | 3 | 4 | 4 | 4 | 4 | 4 |
| HA - Haemagglutinin. NA - Neuraminidase. M - Matrix protein. NS - Non-structural protein. PB2 - Polymerase basic protein 2. PB1 - polymerase basic protein 1. NP - Nucleoprotein. PA - Polymerase acidic protein. *One virus not confirmed H3N2 due to incomplete sequencing results. | ||||||||
Genetic groups
The HA gene of a total of 256 influenza viruses (152 A(H1)pdm09, 96 A(H3), 5 B/Victoria, and 2 B/Yamagata) was sequenced and attributed to a genetic group (see Table 14). In addition, one seasonal A(H1N2) reassortant was detected, which is described further under Characterisation of the A(H1N2) seasonal reassortant below.
| Genetic group | Number of viruses |
Appendix for phylogenetic tree |
|---|---|---|
| A(H1)pdm09 | 1. | |
| 6B.1 (H1/Michigan/45/2015) | 152 | |
| A(H3) | 2. | |
| 3C.2a1b (H3/Alsace/1746/2018) | 83 | |
| 3C.2a2 (H3/Switzerland/8060/2017) | 10 | |
| 3C.3a (H3/England/538/2018) | 3 | |
| B/Victoria | 3. | |
| 1A (B/Brisbane/60/2008) | 1 | |
| 1AΔ162–164) (B/Hong Kong/269/2017) | 4 | |
| B/Yamagata | 4. | |
| 3 (B/Phuket/3073/2013) | 2 |
Influenza A(H1N1)pdm09
All 152 A(H1N1)pdm09 viruses for which the HA gene was sequenced belonged to genetic group 6B.1, all with the HA1 amino acid substitutions S74R, S164T, and I295V (subgroup 6B.1A) and with the majority also having an S183P substitution (see the phylogenetic tree for influenza A(H1N1)pdm09 in Appendix 1). The 6B.1 genetic group also dominated (1,882 out of 1,885 viruses) among those reported in the European surveillance system during the 2018–2019 season (11). Recently circulating viruses, all with S74R, S164T, and I295V substitutions (subgroup 6B.1A) and with the majority also having S183P, have shown good reactivity with ferret antiserum raised against the 2018–2019 vaccine virus A/Michigan/45/2015 (clade 6B.1) (12). However, in an antigenic assay using post-vaccination paediatric sera, recent 6B.1 viruses having the S74R, S164T, and I295V along with the S183P substitution were antigenically distinguishable from cell culture and egg-propagated A/Michigan/45/2015 viruses (6). The recommended vaccine virus for the 2019–2020 northern hemisphere vaccine is A/Brisbane/02/2018, which contains this S183P substitution (6). Of the characterised Swedish viruses, 12 originated from vaccinated individuals of which seven were 65 years or older, The remaining five were 3 (with known immunosuppression), 33, 38, 50, and 52 years old.
Influenza A(H3N2)
The majority (87%) of the 95 A(H3N2) viruses, and one H3 with unconfirmed N type due to incomplete sequencing results, belonged to genetic group 3C.2a1b. The remaining belonged to group 3C.2a2 (10%) or group 3C.3a (3%) (see the phylogenetic tree for influenza A(H3N2) in Appendix 2). Group 3C.2a1b was also the dominating group (45%) reported from Europe as a whole, and only 3% of the viruses reported were 3C.2a2, while 25% were 3C.3a. Other groups reported in low numbers included 3C.2a, 3C.2a1, 3C.2a1a, and 3C.3a3 (11). Influenza A(H3N2) viruses in genetic group 3C.2a have been shown to be antigenically similar to the cell culture-propagated vaccine virus for the northern hemisphere in the 2018–2019 season, A/Singapore/INFIMH-16-0019/2016, but are less similar to egg-propagated A/Singapore/INFIMH-16-0019/2016. Viruses in group 3C.3a have shown low similarity to cell culture-propagated A/Singapore/INFIMH-16-0019/2016, but have higher similarity to the egg-propagated A/Kansas/14/2017 (3C.3a), which is the recommended virus for the northern hemisphere vaccine for the 2019–2020 season. However, the 3C.2a1b viruses did show low antigenic similarity to the recommended vaccine virus for the 2019–2020 season (6, 7). Of the characterised Swedish viruses, 13 originated from vaccinated individuals of whom eight were 65 years or older and the remaining five were 20, 38, 52, 56, and 61 years old. These 13 viruses belonged to genetic group 3C2a.1b (n = 12) and 3C.2a2 (n = 1).
Influenza B/Victoria
Four of five characterised B/Victoria viruses belonged to genetic group 1Adel162–164, while one belonged to group 1A (see phylogenetic tree for influenza B/Victoria in Appendix 3). Group 1Adel162–164 was also the dominating group (60%) of the 25 reported B/Victoria viruses from Europe as a whole. Subgroup 1A and 1Adel162–163 were reported in equal proportions (20% each) (11). Viruses in genetic group 1Adel162–163 are antigenically similar to both the cell culture and egg-propagated vaccine viruses included in the northern hemisphere trivalent and tetravalent vaccines for both the 2018–2019 and 2019–2020 seasons, B/Colorado/06/2017 (1Adel162–163). Viruses in genetic group 1A and 1Adel162–164 have less antigenic similarity to the vaccine virus (6).
Influenza B/Yamagata
Only two B/Yamagata viruses were genetically characterised during the season, and both belonged to genetic group 3 (see phylogenetic tree for influenza B/Yamagata in Appendix 4), as did all the 29 B/Yamagata viruses reported from Europe as a whole (11). Analysed group 3 viruses have good similarity to both cell culture and egg-propagated vaccine virus that is included in the tetravalent (but not in the trivalent) vaccine for both the 2018–2019 and 2019–2020 seasons, B/Phuket/3073/2013 (group 3).
Antiviral susceptibility testing
None of the 157 A(H1N1)pdm09, 95 A(H3N2), or 7 influenza B viruses contained any of the substitutions known to be associated with reduced or highly reduced inhibition to oseltamivir or zanamivir. An additional 65 A(H1N1)pdm09-viruses were screened for the H275Y substitution, which causes highly reduced inhibition by oseltamivir, but not by zanamivir, as measured by real time PCR. None of the screened viruses contained the substitution. In Europe as a whole, only eight of 2,824 analysed viruses showed reduced or highly reduced inhibition by one or two of the neuraminidase inhibitors oseltamivir and zanamivir (11).
Eight A(H1N1)pdm09 isolates, three A(H3N2) isolates, and one isolate from the A(H1N2) reassortant virus described in the next section were analysed for phenotypic sensitivity to oseltamivir and zanamivir by NAI-assay at the WHO CC London. All were shown to be in the range of normal inhibition. The NAI analyses at the Health Agency of Sweden have been postponed to September/October 2019 due to an on-going change of equipment (fluorometer).
All M2 genes of the Swedish influenza A viruses (n = 287) had the amantadine resistance substitution S31N.
Characterisation of the A(H1N2) seasonal reassortant
In January 2019, a seasonal A(H1N2) reassortant virus was detected in a sample collected at the end of December 2018 (13). The HA, M, NS, PB1, PB2, and PA gene originated from seasonal A(H1N1)pdm09, while the NA gene originated from seasonal A(H3N2). The HA gene of the virus belonged to the A(H1N1)pdm09 genetic group 6B.1 (see phylogenetic tree for influenza A(H1N1)pdm09 in Appendix 1). The N2 gene did not harbour any of the mutations known to be associated with reduced or highly reduced inhibition, but the M2 gene contained the amantadine resistance mutation S31N. Analyses by WHO CC London showed that this virus was antigenically similar to the current vaccine virus A/Michigan/45/2015 and phenotypically sensitive to both oseltamivir and zanamivir. The virus was named A/Ystad/1/2018 (GISAID EPI_ISL: 336041 (original) and 341924 (isolate)). No additional Swedish cases with this reassortant have been identified. Other recently reported detections of seasonal A(H1N2) reassortants include one reported from the Netherlands in March 2018 (14) and one identified in Denmark in April 2019 (15).
Virus isolation on cell culture
The majority of the samples selected for isolation are collected from other laboratories. The quality of the samples differs depending on, for example, the type of specimen, time since sampling, and storage and shipping conditions. Forty-two of the collected samples with Ct ≤ 30 were cultured on MDCK cells. For nine samples no influenza viruses were isolated or they were excluded due to contamination with bacteria or fungi.
During the 2018–2019 season, 35 virus isolates and 24 clinical samples were shipped to the WHO CC London for further characterisation (one shipment in January and one in June).
Vaccination coverage
Data on vaccination coverage among persons 65 years of age and older have been gathered by Sweden’s 21 county medical officers for their respective county councils since 2003. The Public Health Agency took over this task in 2014. Various methods for estimation have been used in different counties, including the use of vaccination registries, the number of vaccine doses given or distributed, sentinel reports on vaccination coverage, surveys among general practitioners, or patient record data. These methodological differences result in coverage estimates of varying quality and precision. Although the methods vary between counties, the methods within most counties have been roughly the same for the past several years, allowing a comparison over time. An estimate of the vaccination coverage in age groups younger than 65 is included, using data from a subset of county councils where registry data by age group are available throughout the season as well as annually. Data for 2018–2019 came from Gävleborg, Jämtland Härjedalen, Jönköping, Kalmar, Kronoberg, Norrbotten, Skåne, Stockholm, Värmland, Västernorrland, Västmanland, Västra Götaland, and Östergötland.
Coverage among persons 65 years of age and older
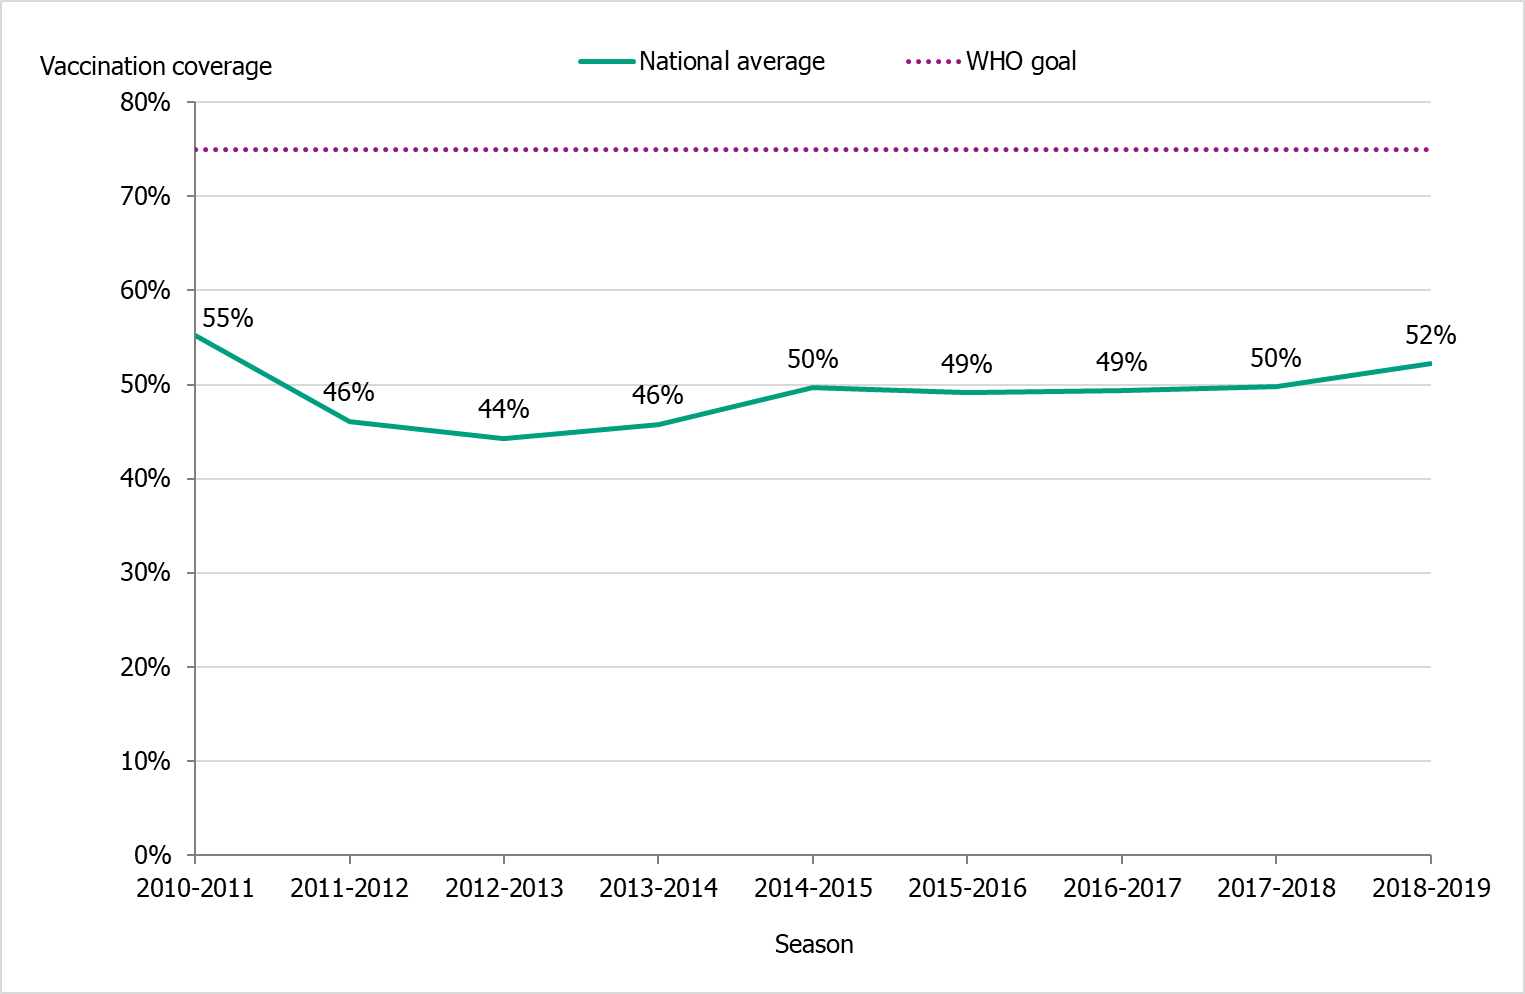
The national vaccination rate among persons aged 65 and over was 52 percent in 2018–2019, which was higher than the previous seven seasons (see Figure 15). Coverage in this age group was slightly higher than the previous season (2017–2018), when the final coverage estimate was 50 percent. The Public Health Agency estimates that over 1 million people aged 65 and older were vaccinated this season.
The higher vaccination coverage reflects the increased demand observed in most county councils in the fall of 2018. Vaccine coverage increased in all age groups despite the vaccine shortage that developed at the end of November 2018. The shortage was primarily caused by an unforeseen increase in influenza vaccinations in Sweden, coupled with the fact that there was a generally high demand for the vaccine in the rest of Europe. All inactivated influenza vaccines that were available for procurement for the 2018–2019 season ran out at the suppliers during the autumn of 2018 and were officially listed as under a medicine shortage. In January 2019, additional doses were delivered to Sweden, but by then efforts to vaccinate and interest in vaccination had decreased.
Coverage rates increased in all age groups, with the biggest increase seen in the age group 65–74 years. Coverage was, as in previous seasons, highest among people aged 85 and older (about 59 percent, see Table 15).
Figure 15. Vaccination coverage among persons aged 65 and older in Sweden, 2010–2011 to 2018–2019.
Regional differences in vaccination coverage
Comparisons among county councils are difficult because estimates use different methods. There is uncertainty associated with each value, but the figure below gives a picture of the current vaccination coverage rates for the age group 65 years and older throughout Sweden (see Figure 16). For more regional data and collection methods, see the Swedish-language summary of the season published in June 2019 (16).
Figure 16. Estimated proportion of vaccinated persons aged 65 and older per county council in Sweden for seasons 2017–2018 and 2018–2019.
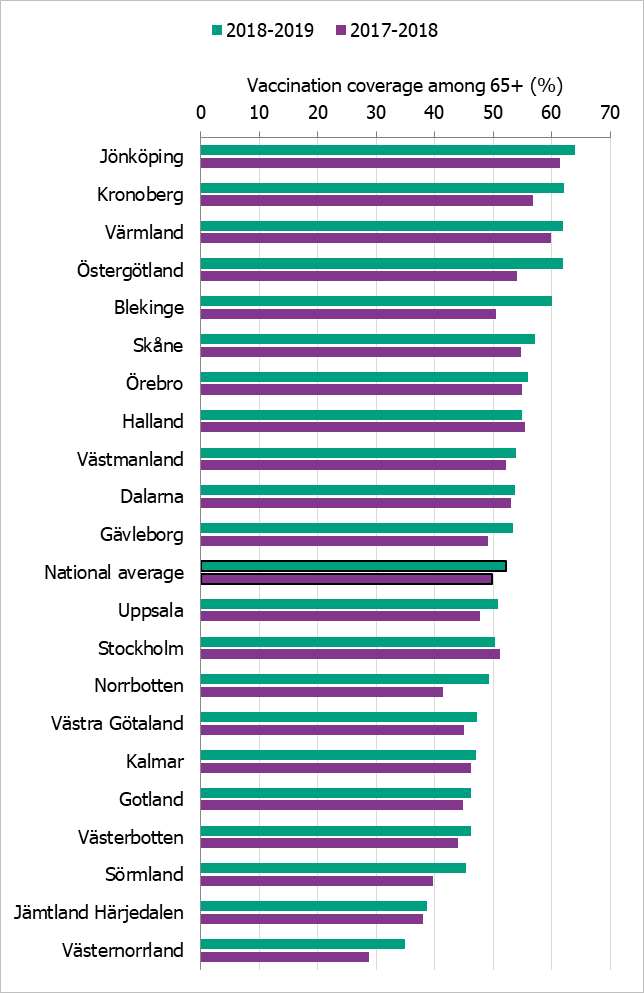
*Notes: Different methods to estimate coverage were used in each county, which makes comparison difficult. Percentages were calculated using the county population on December 31 of each year (Source: Statistics Sweden).
The data from Gotland come from the patient record system and directly from private healthcare offices. In Gävleborg, offices that register vaccinations receive monetary incentives. The data from Jämtland Härjedalen include vaccinations given within the regional healthcare system; doses given at elder care and other facilities are under-reported, which means coverage is underestimated. For Skåne, there are two estimates of the coverage each season; 2017–2018: financial system (54.7%), vaccination register (45.3%); 2018–2019: financial system (57.1%), vaccination register (48.0%). All national analyses use the financial system estimates. Data from Stockholm only include vaccinations given to people in medical risk groups (including pregnancy) or those aged 65 years or older. Uppsala data are based on reports from public and private vaccination clinics through coding of risk groups as a basis for remuneration. Data from Västernorrland only include vaccinations given within the regional health care system; doses given at elder care and other facilities are not included, which means the vaccination coverage is underestimated. Data from Västra Götaland does not include vaccinations given at private vaccination clinics. In Örebro, coverage is calculated based on data from patient records, doses given at county care facilities, and data form private vaccination clinics; doses given at hospitals are not included, which means coverage is underestimated. Data from Östergötland are based on patient records that include patients in county care facilities and the regional healthcare system, but not vaccinations given at private vaccination clinics, at pharmacies, or through occupational health services.
Vaccination coverage among persons under 65 years
It is difficult to estimate vaccination coverage among the medical risk groups under 65 years of age because these groups are hard to define and because data are often missing. Approximately 5–10 percent of the population under 65 years of age belongs to a medical risk group.
Thirteen county councils (see note under Table 15) have reported the number of persons vaccinated under 65 years of age, although risk group status is often unknown. See Table 15 for a breakdown by age group. Data from individual counties indicate a mixed picture regarding whether the increase comes from people in risk groups being vaccinated or from others.
| Age group | 0–17 years | 18–39 years | 40–64 years | 65–74 years | 75–84 years | 85+ years |
|---|---|---|---|---|---|---|
| Percentage vaccinated 2017–2018 (%) | 0.3 | 1.4 | 4.2 | 41 | 56 | 57 |
| Percentage vaccinated 2018–2019 (%) | 0.4 | 1.8 | 4.8 | 44 | 58 | 59 |
| Population (31 Dec 2018) | 1,785,844 | 2,340,031 | 2,605,407 | 902,110 | 536,943 | 212,147 |
| Data come from Gävleborg, Jämtland Härjedalen, Jönköping, Kalmar, Kronoberg, Norrbotten, Skåne, Stockholm, Värmland, Västernorrland, Västmanland, Västra Götaland, and Östergötland. | ||||||
Vaccination coverage among health care workers
There is no national data on vaccination coverage against influenza among healthcare workers (HCWs). It is also difficult to define which personnel groups should be included and which denominator should be used. Because there are no national recommendations for influenza vaccination of HCWs (except for those who care for severely immunocompromised patients), the Public Health Agency does not usually collect information on the coverage rate in this group. However, because of the vaccine shortage, the agency has gathered all available information.
Some county councils campaigned in autumn 2018 to get more HCWs to be vaccinated. However, when the vaccine shortage occurred, many county councils had to cancel vaccination occasions for HCWs. The effect of the shortage on vaccination coverage among HCWs was reported to differ between different county councils.
Syndromic surveillance
Two systems of syndromic surveillance were used during the 2018–2019 influenza season – Webbsök (Web search) and telephone calls to the medical advice line 1177 Vårdguiden. Webbsök is an automated system established in 2008 that uses a statistical model and completely anonymous data from a medical advice website to estimate the development of sentinel ILI incidence. Data are received daily and analysed weekly. The results are published on the web every Monday morning during the influenza season in the form of a graph, which is three days ahead of the publication of the weekly influenza bulletin. Webbsök was used until week 12, 2019, when the surveillance system was suspended due to technical developments.
In collaboration with the medical telephone advice line 1177 Vårdguiden, the Public Health Agency receives aggregated weekly data on calls from a system called Hälsoläge. The age group and main reason for calling are registered for all callers. The reported data include the number of calls related to cough, fever, and sore throat. The proportion of calls related to fever in children has been found to be a good indicator of influenza activity in the community.
Web search data (Webbsök)
According to Webbsök, the 2018–2019 influenza season lasted for at least 21 weeks, from week 44, 2018, to week 12, 2019, when the surveillance was suspended due to technical developments (Figure 17). At that time, influenza activity was low, but Webbsök had not yet indicated the end of season. Between week 27, 2018, and week 12, 2019, a total of 308,671 queries related to influenza were entered, which was 4.8% of the total number of queries on the website 1177.se. As a percentage of searches, this was lower than the previous season, when approximately 318,031 searches made up 5.2 percent of all searches during the same period.
Webbsök had two peaks, one in week 52, 2018, and one in week 6, 2019. In northern Sweden (Norrland), the first peak was higher than the second, which reflected the pattern in the number of laboratory-confirmed influenza cases. In the middle parts of the country (Svealand) the first peak was also slightly higher than the second, while in the southern parts (Götaland) both peaks were equally high. During the season, Webbsök reached medium activity for a total of four weeks (week 52, 2018, and weeks 5–7, 2019), and the other weeks were at a low level. The second peak in week 6, 2019, corresponded with the peak for the laboratory-based surveillance (Figure 18).
The update of the system is on-going, and Webbsök is tentatively expected to start again in the fall of 2019.
Figure 17. Webbsök’s estimated proportion of the population with ILI per week, 2016–2019. Start of the epidemic is marked with a black dot.
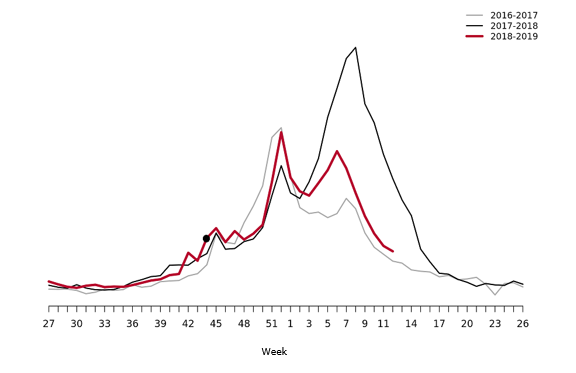
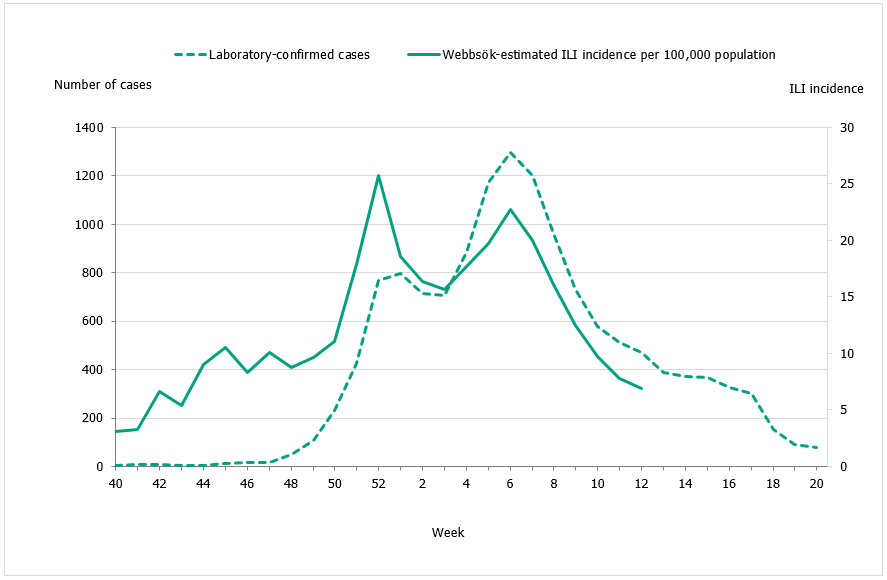
Figure 18. Webbsök’s estimated proportion of persons with ILI (incidence per 100,000 population) and the number of laboratory-confirmed cases, 2018–2019.
Telephone advice line data (1177 Vårdguiden)
The number of calls to 1177 Vårdguiden regarding fever in children exceeded the epidemic threshold for the 2018–2019 season in week 50, peaked in week 6, and ended in week 16. The number of calls was at a low level for most of the season, but reached a medium level during weeks 4–8, 2019.
An average of 5.6 percent of the calls throughout the season (weeks 40–20) were regarding children with fever (Figure 19). This was slightly higher than the previous season when this figure was 5.4 percent. The highest number (4,561) and percentage of calls (9.8 percent) were registered during week 6, 2019, which was higher than the previous season peak (4,039 calls and 8.6% of all calls). This peak came one week earlier than the peak in the laboratory-based surveillance.
Among children 0-4 years, the proportion of calls about fever was significantly higher compared to the previous five seasons. This indicator reached a high level during four weeks (week 52, 2018, and weeks 3–5, 2019) and a very high level for two weeks (weeks 6–7, 2019). An average of 24 percent of calls in this age group concerned fever throughout the season, and the highest proportion of calls (33 percent) was registered during week 6, 2019.
A noticeable peak in calls is often seen around the Christmas holidays every year, followed by a drop. The reason for this pattern might be decreased access to face-to-face healthcare services during the holidays leading to an increase in telephone consultations.
Figure 19. Percentage of telephone calls regarding fever in children received by the medical advice line 1177 Vårdguiden for the past three seasons. Start and end points of the epidemic are marked with black dots.
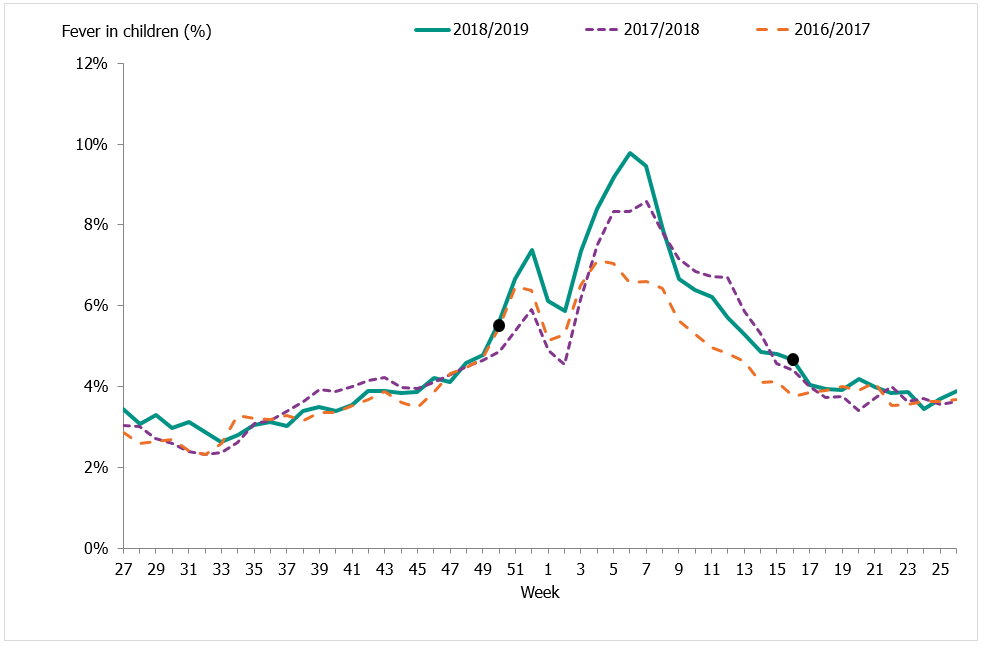
Hälsorapport
The system Hälsorapport (“Health report”) is a web-based reporting panel that helps the Public Health Agency to get a picture of the Swedish population’s health and views on health. It builds on the experience and knowledge gained from previous community-based surveillance systems used in Sweden as well as the Influenzanet network. Approximately 5,900 people aged 1 to 85 years participate in Hälsorapport and receive a health-related survey approximately once a month. Between week 50, 2018, and week 10, 2019, participants received weekly surveys with questions on their health status for the preceding week. If the participants reported that they had fallen ill, they were asked to report symptoms. Based on these reports, the Public Health Agency of Sweden was able to estimate the weekly cumulative incidence of ARI and ILI in Sweden. In addition, participants were asked about certain measures of disease severity, such as healthcare-seeking behaviour and work or school absenteeism.
Preliminary results show that around 2.2 percent of Sweden's population had ILI during the peak week of influenza, week 6 (see Figure 20). More children under 5 years of age were ill compared to the 2017–2018 season, which was in line with laboratory surveillance. In the age group 5–19 years and among people 70 years and older, a lower morbidity was seen compared to last season, which was also consistent with laboratory surveillance. Significantly fewer adults aged 50 years and older called 1177 Vårdguiden this season, compared to the previous intense season.
Figure 20. Proportion of the Swedish population with ILI per week and the percentage of positive samples from laboratory surveillance, 2018–2019.
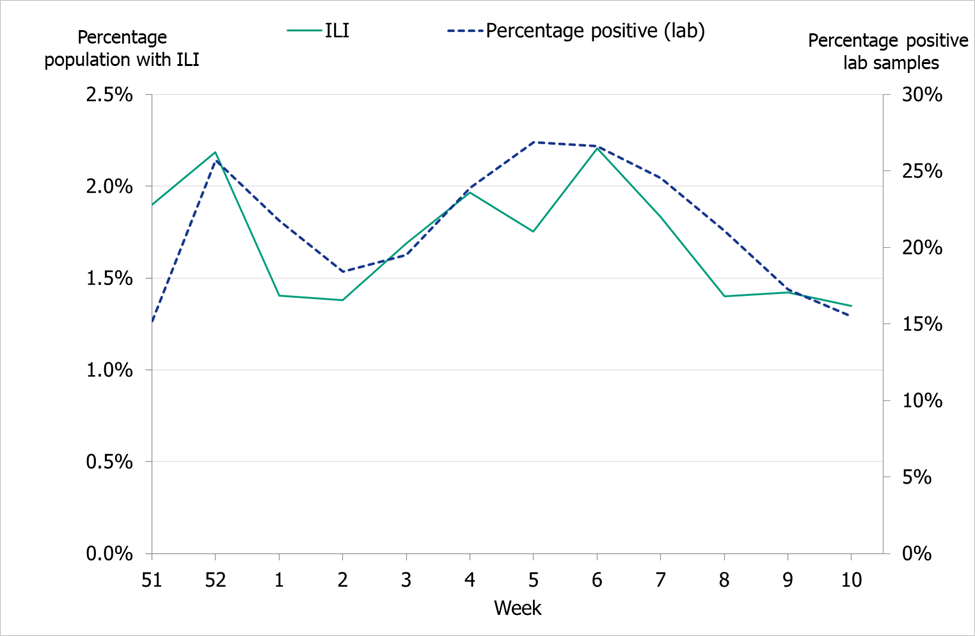
Quality assurance
Different external quality assurance programmes are used to ensure the quality of the diagnostics done in Sweden and of the analyses done by the Public Health Agency. Surveillance is dependent on standardised virological methods.
At the Public Health Agency, one-step real-time RT-PCR assays are used detect influenza A and B, to subtype the influenza A-positive samples, and to discriminate between the two influenza B lineages. These assays have also been evaluated and implemented for avian influenza diagnostics. They are sensitive, rapid, and can easily be scaled up if necessary. The Public Health Agency continuously monitors the genomic sequences of circulating influenza strains to which the PCR assays are directed in order to detect mutations that could affect their sensitivity. The Public Health Agency also performs regular validation of each assay twice a year, both ahead of the influenza season and during the peak. The PCR protocols are shared with the other laboratories in Sweden, and the laboratories that use these PCR systems are encouraged to send all samples with deviating results to the agency for sequence analysis.
Every year the Public Health Agency produces a panel PCR for the Swedish laboratories on behalf of the External Quality Assessment for Clinical Laboratory Investigations (EQUALIS). This allows the laboratories to measure the analytic sensitivity and specificity of their method. The majority of the laboratories performing diagnostics for influenza use commercial rapid PCR kits. In the beginning of the season, a questionnaire is sent to all laboratories with a question concerning methods used. Kits used by two or more laboratories are selected for extra quality controls during the season in order to ensure that circulating influenza strains are detected with these assays.
To ensure that the analyses performed at the Public Health Agency are correct, the agency participates in different external quality assurance programmes.
National quality assurance programme for influenza PCR
In September 2018, the Public Health Agency produced a new PCR panel for the Swedish laboratories, which was distributed by EQUALIS. Twenty laboratories participated in the panel, and only two of these reported 10/10 correct results and only nine laboratories reported 9/10 correct results (Figure 21). The majority of the laboratories did not detect influenza B in the sample with the lowest viral load.
Figure 21. Results of the Swedish External Quality Assessment panel 2018.
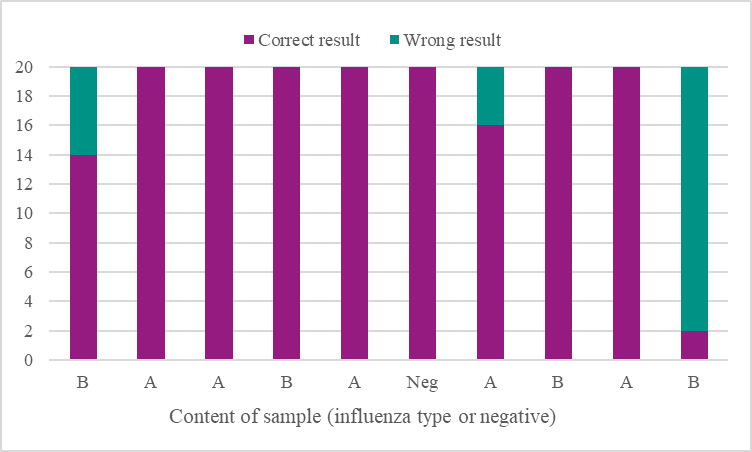
Control of commercial rapid PCR-kits
During the 2018–2019 season, an increasing number of laboratories used commercial rapid PCR kits for influenza diagnostics. Results of a questionnaire sent to all 25 microbiological laboratories in Sweden showed that all laboratories used a commercial PCR assay (five laboratories combined both commercial and in-house assays).
Six different kits were tested this season:
- Simplexa™ Influenza A/B & RSV Kit (Focus Diagnostics)
- Xpert® Flu/RSV (Cepheid)
- Alere™ Influenza A & B Test (Abbott)
- Allplex, panel 1, 2, and 3 (Seegene)
- FILMARRAY® Respiratory Panel (Biomérieux)
- Accula (Mesabiotech)
The laboratories received a number of samples on two occasions – at the beginning and during the peak of the season. A total of nine positive samples (diluted isolates) were tested with the different kits, and all gave 100% correct results. The results were shown on the Public Health Agency website so that other laboratories using the same kits would have knowledge of the results.
External quality assurance programmes
The Public Health Agency participated in three external quality assurance programmes during 2018–2019.
1) European External Influenza Virus Quality Assessment Programme 2018
- Molecular detection, typing, sub/lineage-typing. Ten samples were analysed and 100% were correct.
- Virus isolation. Eight samples were analysed, and correct results were obtained for four of them. We found that we had problems with isolation of influenza B.
- Genetic characterisation. The seven samples analysed by NGS were all correctly reported.
- Molecular and phenotypic antiviral susceptibility determination. The nine samples analysed genetically by NGS and Sanger sequencing were all correctly reported. The two isolates analysed phenotypically by NAI-assay (fluorescence-based MUNANA) were both correctly reported. Phenotypic analysis of the eight samples included in the isolation and detection challenges were not analysed with respect to phenotypic antiviral susceptibility due to poor isolation results.
2) Annual WHO External Quality Assessment panel for influenza (no. 17) 2018
- Molecular detection, typing, sub/lineage-typing. The 10 samples analysed by real-time PCR were correctly typed (A or B), and 9/10 were correctly subtyped. One sample (type A) could not be subtyped with this technique, but was identified as subtype A(H9) by WGS (NGS) and later confirmed by the final report. This result was expected because the Public Health Agency does not have a real-time PCR system for H9 subtyping.
- Genotypic and phenotypic antiviral susceptibility determination. Genotypic analyses were performed by NGS and Sanger sequencing, and phenotypic analysis was performed by NAI assay (fluorescence-based MUNANA). All three samples were correctly reported.
3) INFRNA panel from Quality Control for Molecular Diagnostics (QCMD) 2018
- Typing, sub/lineage-typing. All 10 samples were correct typed/subtyped by real time PCR.
References
- Public Health Agency of Sweden, Rekommendationer om influensavaccination till riskgrupper [Recommendations for influenza vaccination of risk groups]. Stockholm: Public Health Agency of Sweden; 2018 [cited 2019-08-08] Available from: https://www.folkhalsomyndigheten.se/publicerat-material/publikationsarkiv/r/rekommendationer-om-influensavaccination-till-riskgrupper/
- Kissling Esther, Rose Angela, Emborg Hanne-Dorthe, Gherasim Alin, Pebody Richard, Pozo Francisco, Trebbien Ramona, Mazagatos Clara, Whitaker Heather, Valenciano Marta, European IVE group. Interim 2018/19 influenza vaccine effectiveness: six European studies, October 2018 to January 2019. Euro Surveill. 2019;24(8):pii=1900121. https://doi.org/10.2807/1560-7917.ES.2019.24.1900121
- Public Health Agency of Sweden. Publikationer [Publications]. [Internet]. Stockholm: Public Health Agency of Sweden; 2019 [cited 2019-08-08] Available from: http://www.folkhalsomyndigheten.se/publicerat-material/publikationer/
- Public Health Agency of Sweden, Aktuell influensarapport [Current Weekly Report]. [Internet]. Stockholm: Public Health Agency of Sweden; 2019 [cited 2019-08-08] Available from: https://www.folkhalsomyndigheten.se/folkhalsorapportering-statistik/statistikdatabaser-och-visualisering/sjukdomsstatistik/influensa-veckorapporter/aktuell-influensarapport/
- Public Health Agency of Sweden, Arkiv 2018/2019 [Influenza Weekly Report Archive, 2018–2019]. [Internet]. Stockholm: Public Health Agency of Sweden; 2019 [cited 2019-08-08] Available from: https://www.folkhalsomyndigheten.se/folkhalsorapportering-statistik/statistikdatabaser-och-visualisering/sjukdomsstatistik/influensa-veckorapporter/arkiv-20182019/
- World Health Organization, Recommended composition of influenza virus vaccines for use in the 2019–2020 northern hemisphere influenza season. [Internet]. Geneva: World Health Organization; 2019. [published 2019-02-21, updated 2019-03-21, cited 2019-08-08]. Available from: https://www.who.int/influenza/vaccines/virus/recommendations/2019_20_north/en/
- World Health Organization, Addendum to the recommended composition of influenza virus vaccines for use in the 2019–2020 northern hemisphere influenza season. [Internet]. Geneva: World Health Organization; 2019. [published 2019-02-21, updated 2019-03-21, cited 2019-08-08]. Available from: https://www.who.int/influenza/vaccines/virus/recommendations/2019_20_north/en/
- Public Health Agency of Sweden, Trivalenta och tetravalenta vacciner mot säsongsinfluensa [Trivalent and Tetravalent Seasonal Influenza Vaccines]. Stockholm: Public Health Agency of Sweden; 2019 [cited 2019-08-08] Available from: https://www.folkhalsomyndigheten.se/publicerat-material/publikationsarkiv/t/trivalenta-och-tetravalenta-vacciner-mot-sasongsinfluensa/
- Public Health Agency of Sweden, Pandemiberedskap [Pandemic preparedness]. [Internet] Stockholm: Public Health Agency of Sweden; 2019 [updated 2018-05-25, cited 2019-08-08] Available from: https://www.folkhalsomyndigheten.se/smittskydd-beredskap/krisberedskap/pandemiberedskap/
- EuroMoMo Project, Mortality monitoring in Europe [Internet]. Danmark: EuroMoMo Project; 2019 [cited 2019-08-08]. Available from: http://www.euromomo.eu/
- European Centre for Disease Prevention and Control, World Health Organisation, Flu News Europe for Week 20/2019. 2019. [Published on 2019-05-24, cited 2019-08-15]. Available from: http://flunewseurope.org/Archives
- European Centre for Disease Prevention and Control, Influenza virus characterisation – Summary Europe, May 2019. Stockholm: ECDC; 2019. [Published 2019-06-10, cited 2019-08-15] Available from: https://ecdc.europa.eu/en/publications-data/influenza-virus-characterisation-may-2019
- Wiman A, Enkirch T, Carnahan A, Bottiger B, Hagey TS, Hagstam P, et al. Novel influenza A(H1N2) seasonal reassortant identified in a patient sample, Sweden, January 2019. Euro Surveill. 2019;24(9).
- Meijer A, Swaan CM, Voerknecht M, Jusic E, van den Brink S, Wijsman LA, et al. Case of seasonal reassortant A(H1N2) influenza virus infection, the Netherlands, March 2018. Euro Surveill. 2018;23(15)
- Trebbien Ramona, Koch Anders, Nielsen Lene, Kur Dar Kristian, Westerström Pontus, Krause Tyra Grove. A case of reassortant seasonal influenza A(H1N2) virus, Denmark, April 2019. Euro Surveill. 2019;24(27). Available from: https://www.eurosurveillance.org/content/10.2807/1560-7917.ES.2019.24.27.1900406
- Public Health Agency of Sweden, Sammanfattande rapport för säsongen 2018–2019 [Summary report for the 2018–2019 season]. [Internet] Stockholm: Public Health Agency of Sweden; 2019 [updated 2019-06-17, cited 2019-08-22] Available from: https://www.folkhalsomyndigheten.se/folkhalsorapportering-statistik/statistikdatabaser-och-visualisering/sjukdomsstatistik/influensa-veckorapporter/arkiv-20182019/